the Creative Commons Attribution 4.0 License.
the Creative Commons Attribution 4.0 License.
 | 28 Jan 2020
Stabilising large grains in self-forming steep channels
William H. Booker
Brett C. Eaton
It is understood that the interaction between sediment supply and discharge drives first-order behaviour of alluvial deposits. The influence of the grain size distribution over the mobility and resultant evolution is, however, unclear. Four experiments were conducted in a scaled physical model for two grain size distributions, analogous to a one-dimensional self-formed alluvial fan. We demonstrate the unsuitability of the median grain size as a predictor of deposit behaviour at flows when the material is not equally mobile. The results instead suggest, during conditions of unequal mobility, that the largest grains control the transport efficiency of the overall sediment mixture, and thus also the morphodynamics of the deposit and its tendency to store or evacuate material. Deposits appear to show a dependence upon the rate of material supply more strongly when the likelihood of its motion is less equally distributed (i.e. under partial transport conditions). If the coarse fraction (e.g. greater than 84th percentile) is instead mobile due to increased discharge or because of their relative size, transport rates will increase and the behaviour of the mixtures converge to a common state, with morphology influenced by the material's mobility.
- Article
(8021 KB) - Full-text XML
- BibTeX
- EndNote


Gravel bed rivers adjust their boundaries from the grain to the reach scale in response to the supplied sediment and water discharges (Leopold and Maddock, 1953; Lane, 1955; Howard and Kerby, 1983; Madej and Ozaki, 1996; Eaton and Church, 2004; Hassan et al., 2007). The feedbacks and interactions between antecedent flow and sediment discharge control river channel form (Fukuoka, 1989) and thereby influence channel response, e.g. as a response to flow increases (Masteller and Finnegan, 2017). Natural channels are likely to experience a distribution of flow rates and, therefore, corresponding modes of transport (e.g. Ashworth and Ferguson, 1989; Warburton, 1992). Central to the behaviour of gravel bed rivers is this response to their environment as the flow does not regularly or greatly exceed the threshold of sediment mobility (e.g. Church, 2006). In a channel the aggradation or degradation of material will lead to changes in its elevation, representing a balance between the amount of energy and material provided to it. Lane (1955) proposed that grade represents this balance as
wherein the left-hand side of the proportionality represents the sediment transport efficiency, given by the ratio between sediment supply (Qb) and the product of discharge (Q) and slope (S). The right-hand side is the reciprocal of the sediment flux calibre (D). Church (2006) recast this relation in a dimensionally balanced version, which can be written as follows:
where d is the flow depth. In Church's version, D is specifically defined to be the median bed surface size, based on the understanding of the hiding and/or exposure processes controlling the entrainment of sediment from a mixture.
Accordingly, mixtures of the same median grain size, under the same water and sediment discharges, should form to the same slope because of their equal transport efficiency. Transport efficiency (η) is defined in the same manner as by Bagnold (1966), in that it relates the work rate of the flow to the stream power available and describes the efficiency of the system in converting stream power into work (i.e. sediment transport) and is therefore higher in more efficient systems. That is, systems with higher η values will organise to lower slopes, because they are more capable of transporting the supplied material, as described by its discharge. Here, it is reformulated by neglecting the mass flux term from its original form, instead replicating the dimensionless, volumetric consideration used by Eaton and Church (2011):
whereby it functions as a relationship between the system's mass and energy inputs, outputs, and processes.
The validity of using a single characteristic grain size as a descriptor of a whole system's state is, however, fundamentally flawed. We know that surficial adjustment, bedforms, and macroforms modulate bed material sediment transport rate, acting to dissipate energy and provide stability to the overall channel (Cherkauer, 1973; Montgomery and Buffington, 1997; Venditti et al., 2017). For example, it has been thought that grains may stabilise through rotation (Masteller and Finnegan, 2017), their organisation into cells (Church et al., 1998; Monsalve and Yager, 2017), and the formation of alternate bars and patches (Lisle et al., 1991; Dietrich et al., 2006; Nelson et al., 2010). One of the most well studied of these adjustment phenomena is the coarsening of the bed surface due to the preferential removal of fines or their kinetic sieving into the subsurface, until an armour layer develops that approximately equalises the threshold entrainment stress of the bed (Parker and Klingeman, 1982; Parker et al., 1982b; Andrews, 1983). Armour may develop in both sediment-starved reaches as static armour (Sutherland, 1987; Dietrich et al., 1989; Parker and Sutherland, 1990; Kondolf, 1997; Vericat et al., 2006; Nelson et al., 2009) or where sediment supply is present as a mobile armour layer (Parker and Klingeman, 1982; Andrews and Parker, 1987; Parker, 1990). It is the formation of an armour layer that prevents continued transport of the material and stabilises the channel against further deformative work. In addition, MacKenzie and Eaton (2017) demonstrated that it is the largest grains found in the bed material that control channel stability during degradation because of their role in protecting the underlying fine grains. Their work concludes that bed stability cannot be fundamentally linked to the median bed surface grain size, as in sediment transport models developed by Parker (1990) and Wilcock and Crowe (2003).
In contrast to this, our knowledge of the processes stabilising aggrading systems is substantially lacking in direct study; the omission of their explicit focus in the Treatise of Geomorphology is noticeable, in comparison to the myriad of studies based on degrading channels. Systems undergoing aggradation may range in degrees of confinement (i.e. from valley bottoms to alluvial fans), but they are characterised by either a competence or capacity-driven accumulation of sediment relative to their current energy flux. Aggrading systems are often studied, but they are often treated at a greater scale (i.e. channel planform) in the field (e.g. Gilbert, 1917; Harvey, 1991; Benda and Dunne, 1997) or neglected in non-fan experiments. For example, Madej (1982) attributed increases in sediment transport rates to channel geometry changes induced by aggradation in the channel, rather than the manifestation of system variables such as slope (as would be expected with Eq. 1). As a singular process, avulsion acts as a mechanism for channel “stabilisation” in aggrading systems, where sediment transport capacity is maintained through the creation or re-occupation of an alternate channel position (Ashmore, 1982; Field, 2001). Studies also focus upon the influence of supplied material, of which the calibre is important for the resulting trajectory of changes to hydraulics and morphology. An influx of fine sediment will increase sediment transport through increased exposure effects on coarser material (Wilcock et al., 2001; Wilcock and Crowe, 2003; Curran and Wilcock, 2005). On the other hand, coarse material will accumulate either through supply of un-entrainable material (Harvey, 2001) or the role of coarse grains as stabilising loci (Lisle et al., 1991). We could argue, therefore, that there exists a precedent for the role of large grains in controlling the behaviour of aggrading channels, derived from the deposition of those grains supplied to the channel (e.g. Moss, 1963; Dunkerley, 1990).
The applicability of using Eq. (2) to predict the changes in system slope is thus called into question when we consider the role of large grains in the stability of aggrading or degrading systems. We hypothesise that the presence of the large grains will result in different sediment mixture mobilities for aggrading channels, thus different channel morphodynamics and depositional slope, as in MacKenzie and Eaton (2017). In addition, we expect that this effect will not be maintained under discharge increases, as the D84 is suggested to strongly influence the thresholds of mobility within a mixture (MacKenzie et al., 2018). The goal of this paper, therefore, is to test whether or not large grains influence channel stability in aggrading systems, wherein many of the processes thought to produce stabilisation in degrading systems are suppressed. To that end, we present the results for two sets of four experiments paired by median grain size but differentiated by the shape of their distributions, for which Eqs. (1) and (2) would predict similar behaviour. In most studies, slope acts as a response to an existing deposit, e.g. degradation into a bed surface (Parker et al., 1982a). Here, sediment may freely aggrade or degrade and thus slope acts instead as an emergent indicator of the system state, thus allowing its form to fully represent the suite of processes acting upon it, a methodology reserved mostly for fan studies (e.g. Schumm et al., 1987; Clarke et al., 2010). The results described here show that the grain size distribution used affects the resulting behaviour of the deposit and its slope, and the differences between paired experiments are controlled by the experimental boundary conditions.
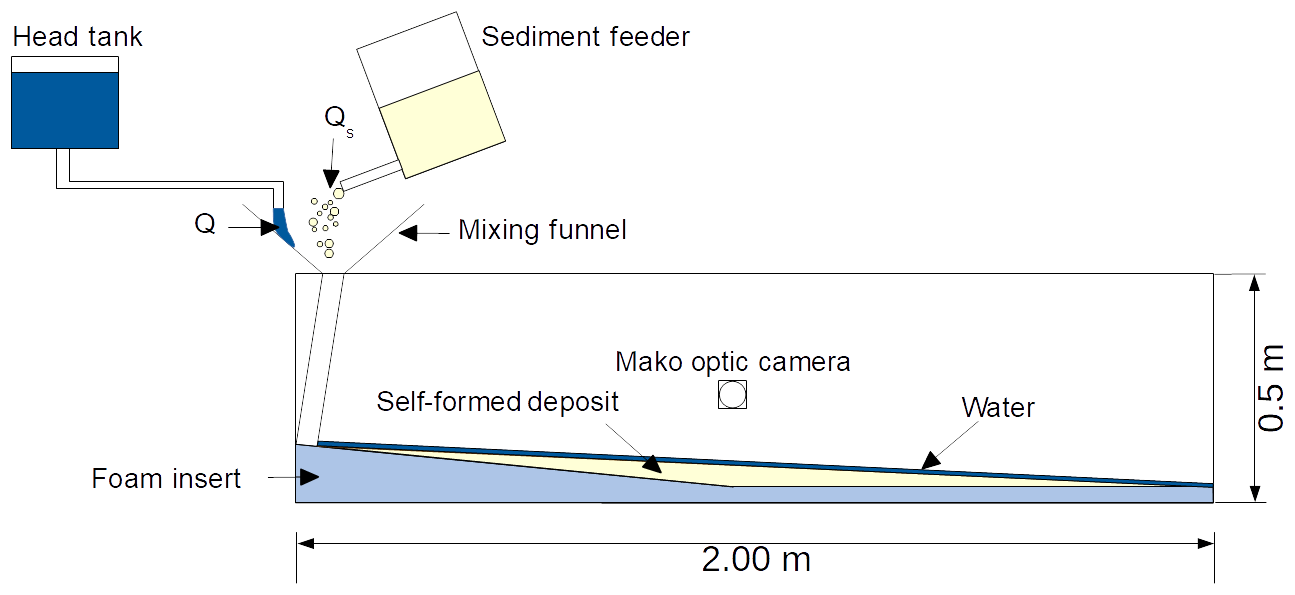
Eight experiments were run in the recently constructed steep mountain channel flume at the University of British Columbia. The flume is acrylic walled, 2 m long by 0.128 m, wide with a foam insert creating a transition from a steep (slope = 0.1 m m−1) upper and flat (slope = 0 m m−1) lower section (Fig. 1), upon which a fan deposit can develop. These deposits that form within the flume are analogous to a one-dimensional fan or to the channel bed of a steep river confined by bedrock walls. Design and methodological cues were taken from previous experiments concerning self-formed deposition (Guerit et al., 2014) and steep channel stability (Lisle et al., 1991).
During the runs reported here, feed and flow were held constant for the length of each experiment. These were conducted under one of four conditions: 100L, 100H, 200L, or 200H, where the number refers to the flow rate (in mL s−1) and the letter to the feed rate (L for 1 g s−1, H for 2 g s−1). The experiments also have a relative sediment concentration compared to the 100L experiment, where a value of 1 represents both factors increasing (i.e. 100L and 200H), 0.5 is a halving of feed relative to flow (i.e. 200L), and 2 is a halving of flow relative to feed (i.e. 100H). This range of values allows us to consider five changes in relative sediment concentration mediated by changes to discharge or sediment feed rate. These are (1) no change in concentration but changes in the total flux magnitude (100L vs. 200H), (2) doubling concentration through increasing sediment feed (100L vs. 100H), (3) doubling concentration through decreasing discharge (200H vs. 100H), (4) halving concentration through increasing discharge (100L vs. 200L), and (5) halving concentration through sediment feed (200H vs. 200L). As in MacKenzie and Eaton (2017), sediment is scaled from gravel-bedded streams found in Alberta, Canada, and truncated at 0.25 mm at the lower end to remove unscalable laminar sub-layer effects for sediment finer than this size limit (Peakall et al., 1996).
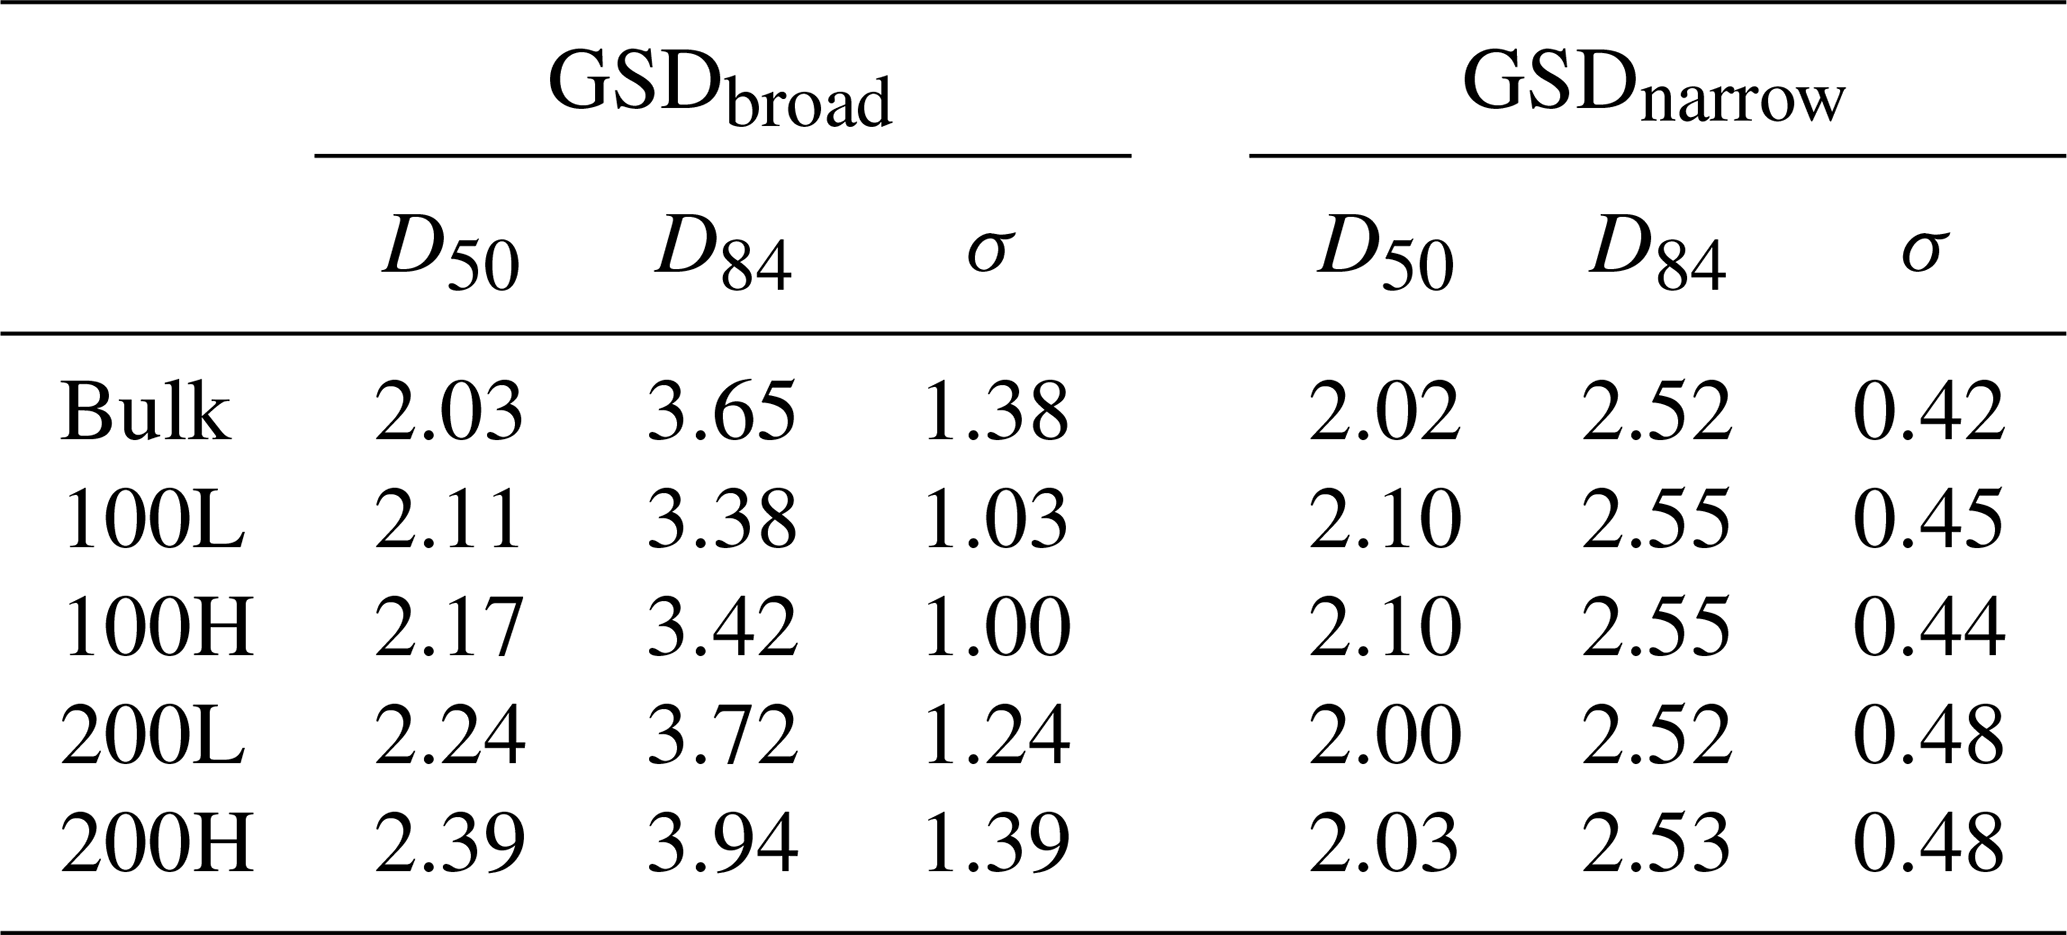
These eight experiments primarily serve to distinguish between the behaviour of two grain size distributions across a range of run conditions. The two grain size distributions (GSDs) share nearly the same D50 (GSDbroad=2.03 mm, GSDnarrow=2.02 mm). The first grain size distribution (GSDbroad) comprises a log-normal distribution from 0.25 to 8 mm (Fig. 2). The second distribution (GSDnarrow) is only comprised of two size classes: 1.4 to 2.0 mm and 2.0 to 2.8 mm (Fig. 2). As a result, GSDbroad has a substantially higher D84 and standard deviation (σ), as would be expected from its substantially coarser and finer tails.

Figure 2Grain size distributions for half-phi classes (a) individually and (b) cumulatively. Grain size metrics are shown in mm.
At the beginning of the experiment, roughness elements were placed on the bed to ensure that the flow remained subcritical during the initial deposit-building stages. Once the sediment feed and water supply were turned on, bed material deposited around the initial roughness elements, burying them and creating a freely adjustable self-formed deposit with a configuration dictated by the grain size distribution of the sediment supply. The data presented here are collected after the sediment has begun to exit the flume. That is, sediment has deposited along the length of the flume, sediment transport out of the flume has begun, and the sediment trap is collecting this output (see Fig. 3). By which time the channel has a self-adjusted roughness, and the influence of the roughness elements themselves is limited. Data collection ended when the supply of sediment was exhausted; thus, run time is proportional to the feed rate.
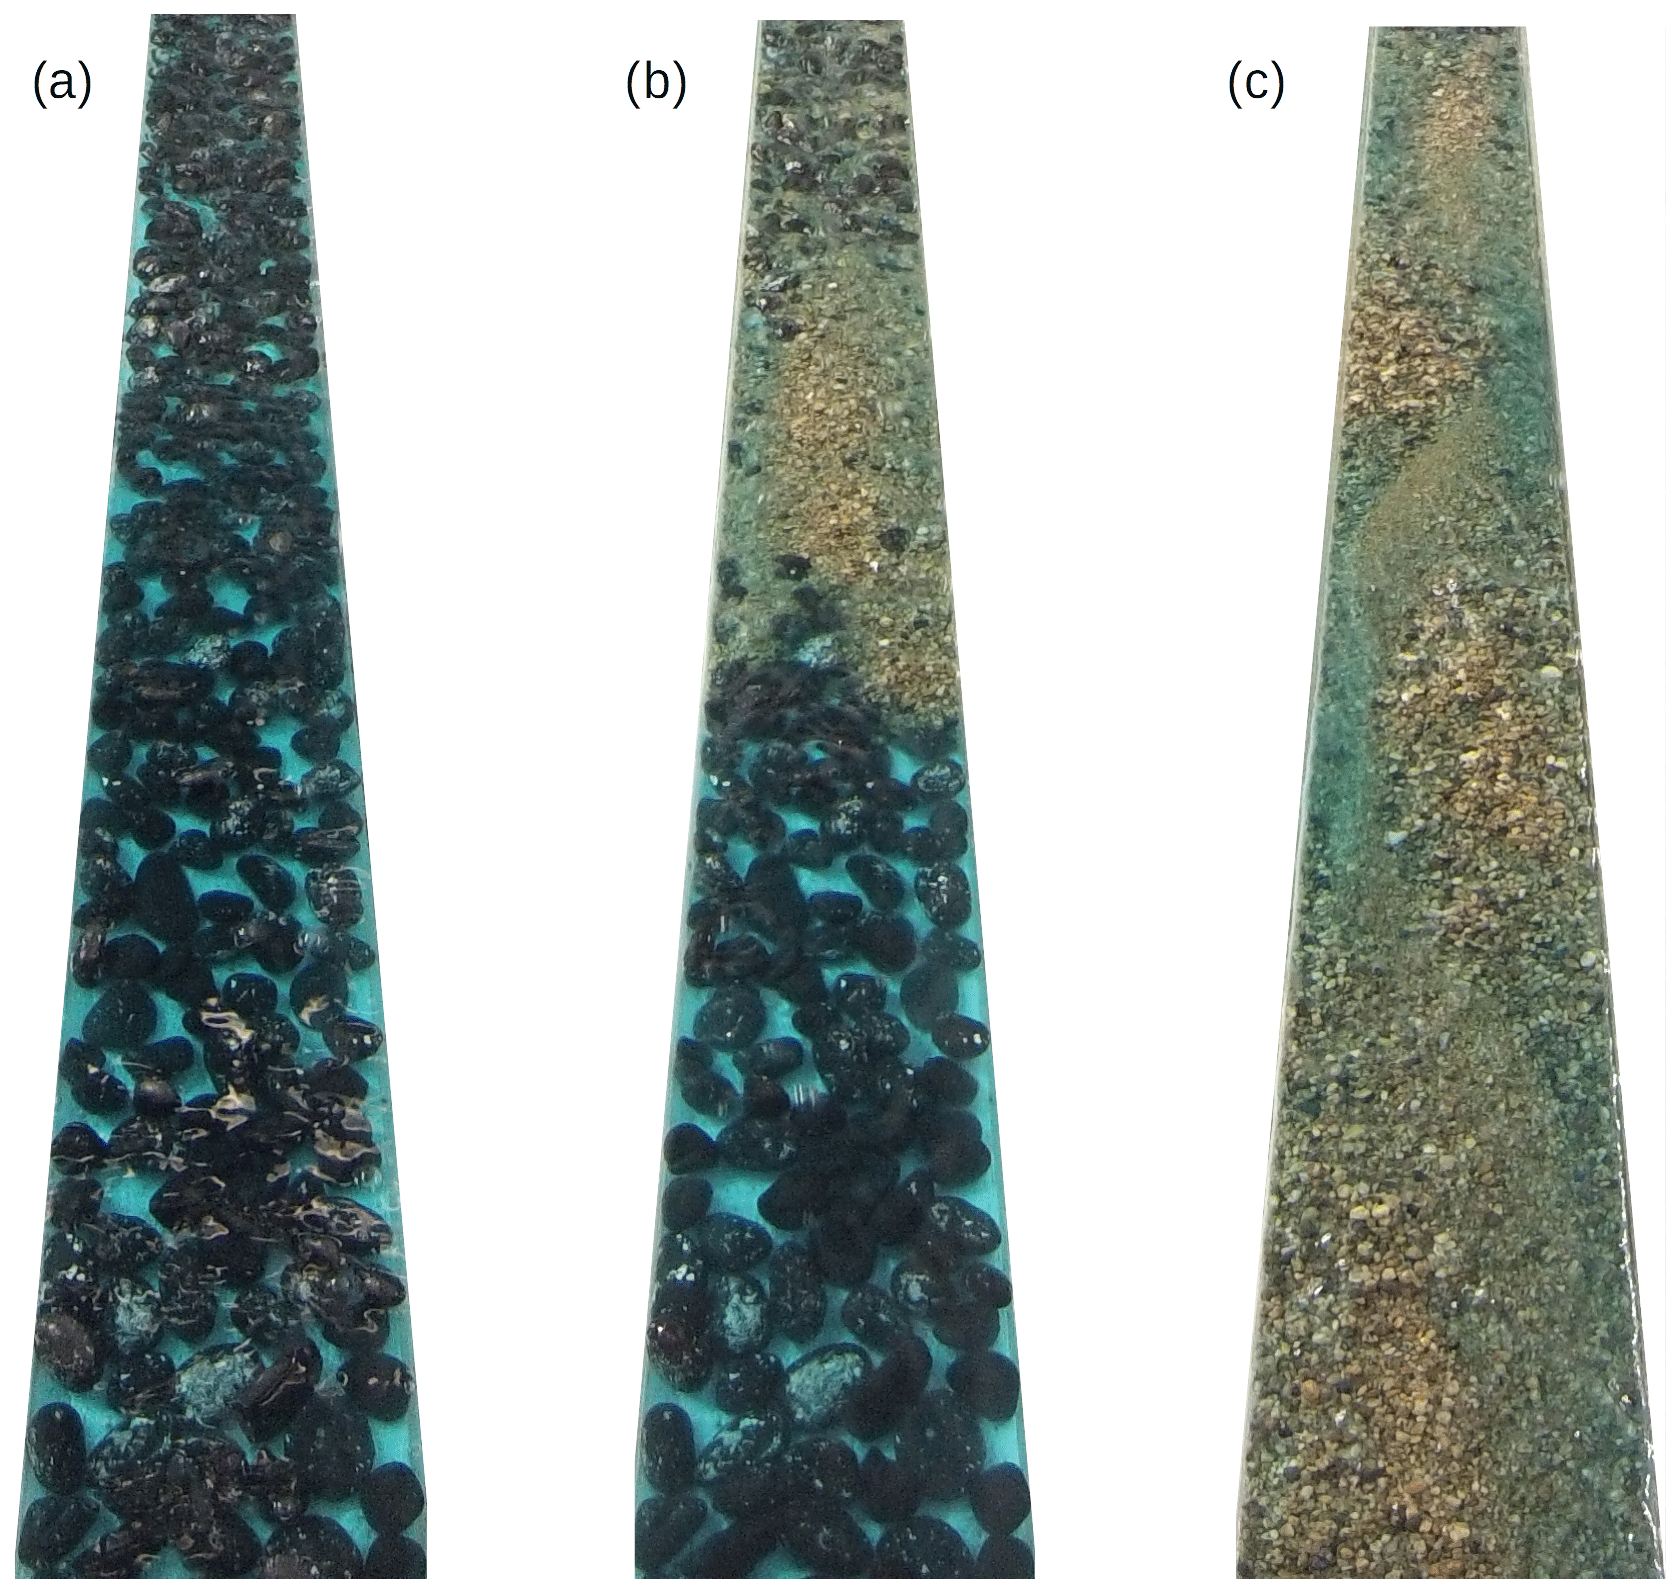
Figure 3Example images of the black roughness elements used to force subcritical flow, and their submergence taken during (a) beginning of experiment with full emergence, (b) partial submergence and (c) onset of transport, almost complete burial and submergence, from experiment 200H using GSDbroad.
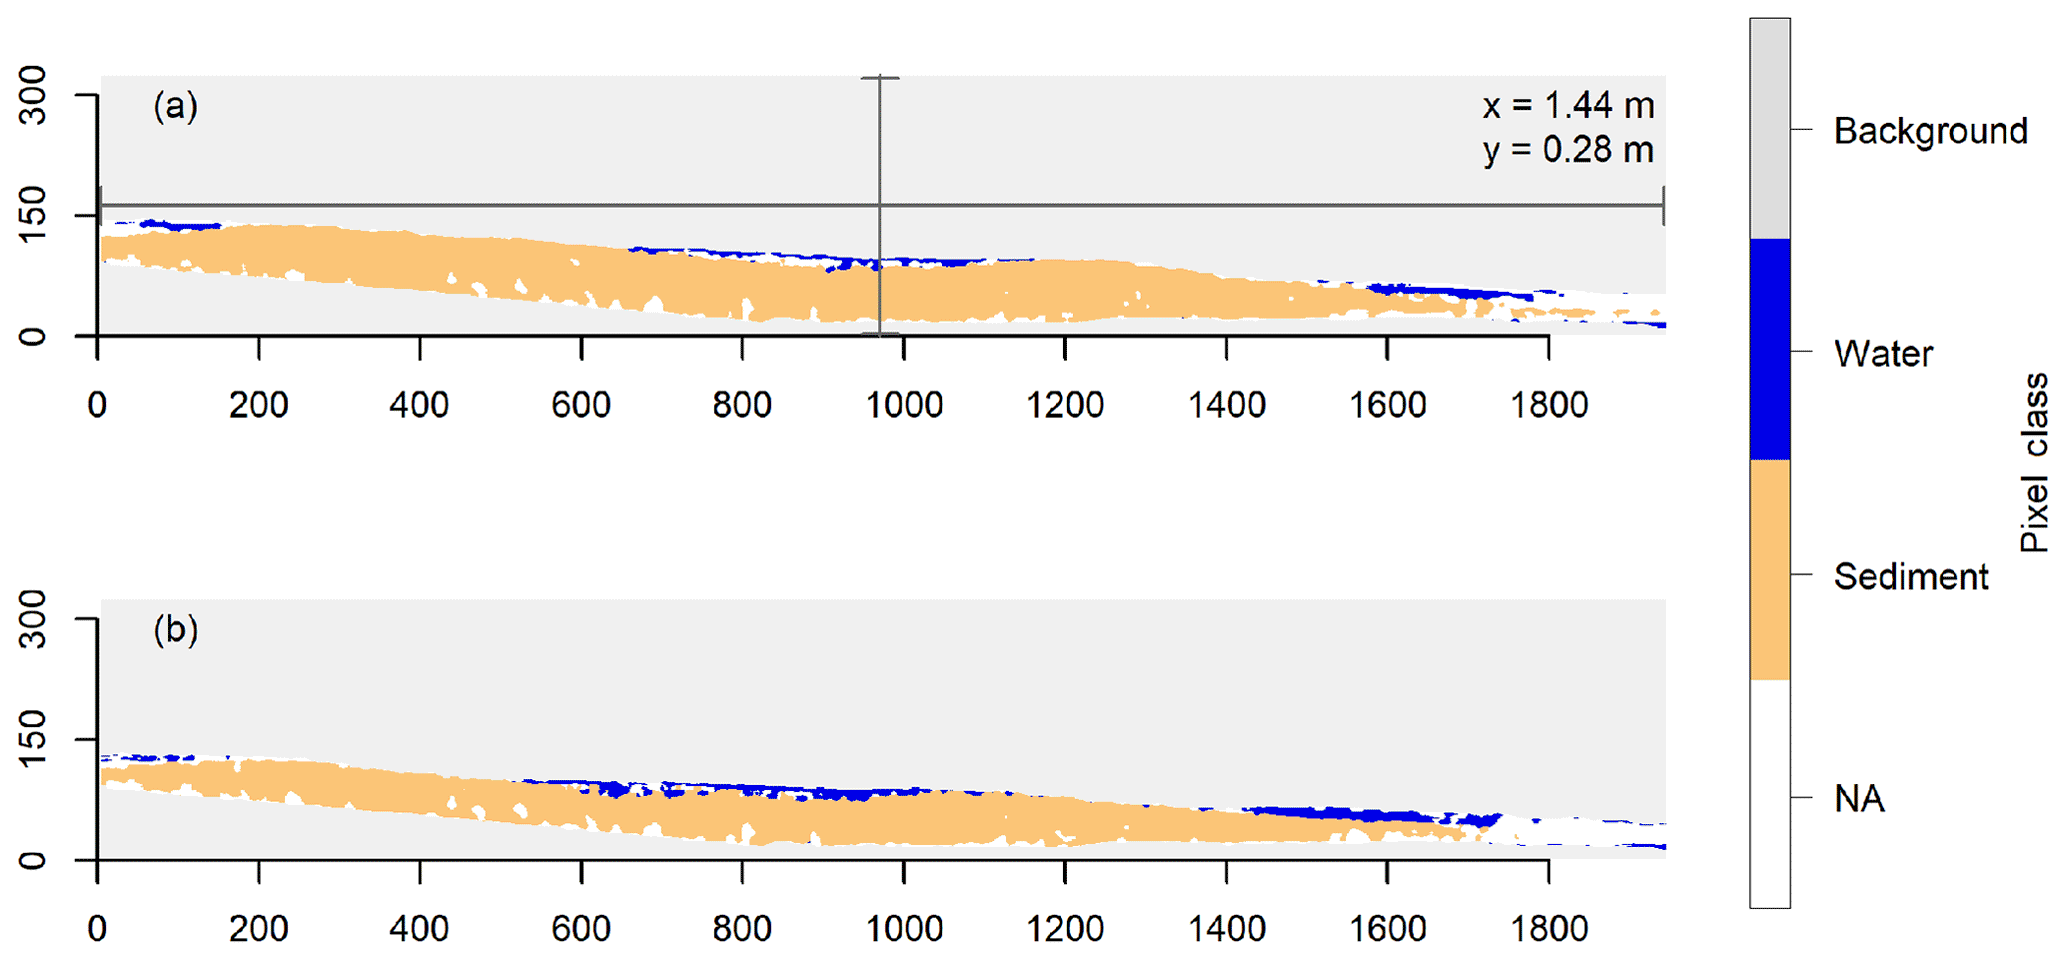
Figure 4Output after image classification at the onset of output for experiment 100L using (a) GSDbroad (T=326 min) and (b) GSDnarrow (T=149 min). Axes are pixel values of the raster, and real distances are provided for scale.
The main source of data used in this study was collected using a side-looking camera to map the evolution of the channel's long profile. A Mako optic camera was positioned perpendicular to flume orientation, and it took photographs at 60 s intervals. The camera itself contains a routine to flatten these images and correct for radial lens distortion, resulting in a nearly perfect orthometric image. An image calibration routine translated pixel values to real-space coordinates, from which a linear regression was fitted to estimate the bulk sediment deposit gradient from the channel profile. Additionally, at 30 s intervals, oblique images of the bed were captured by a GoPro oriented upstream. The images were compiled into videos and submitted with this paper to record the bed state evolution (see Video supplement). Note that in the online videos the name GSD1 refers to GSDbroad, and the name GSD2 refers to GSDnarrow.
Sediment output data were also recorded through the use of a sediment trap emptied at 15 min intervals. The material was captured, dried, and then weighed, giving us mean transport rates for the preceding period and allowing us to calculate relative sediment storage efficiency as the difference between output and input. That is, a relative storage efficiency of 100 % means that all sediment that is input is stored during a time step (Table 3). Additionally, the mean transport rate is the value used in Eq. (3) in order to calculate η values reported later.
2.1 Slope derivation
In order to derive a water surface slope from the profile images, a simple supervised image classification process was applied to each frame to automate the process. First, a random forest model (“randomForest”) was used to assign one of seven sub-classes to RGB pixel values built from a smoothed training image (Liaw and Wiener, 2002). Random forest models utilise decision trees, which minimise some factor, that are built on different, random samples of the training observations and then average the results of each of these decision trees to make predictions from that dataset (Breiman, 2001). Averaging the results of the myriad regressions built in the model thus improves its predictive strength, and random forest models have been employed during supervised classification of remotely sensed images (see Belgiu and Drăguţ, 2016). The sub-classes are sediment, clear water, water with sediment behind it (pool), water surface, background, background with shadow, and the roughness elements. These sub-classes were then grouped into four umbrella classes as sediment, water, background, and roughness elements, with the latter treated as “NA” values and then smoothed using a 7×7 mode pixel filter to reduce noise (Fig. 4). The training image was chosen such that each of these sub-classes was present and then a model built between the red, green, and blue pixel values of each class was applied to every other image in the dataset. The slope values are the water surface slopes defined as the boundary between background class pixels and the highest of either water or sediment class pixels, until the downstream-most extent of sediment. As sediment may infill between the roughness elements, but not contiguously deposit up to that point, a manual mask was applied to the height of the roughness elements to prevent the erroneous reporting of slope values. Example slope profiles show the typical calculation of the regression at the beginning, middle, and end of runs (Fig. 5).
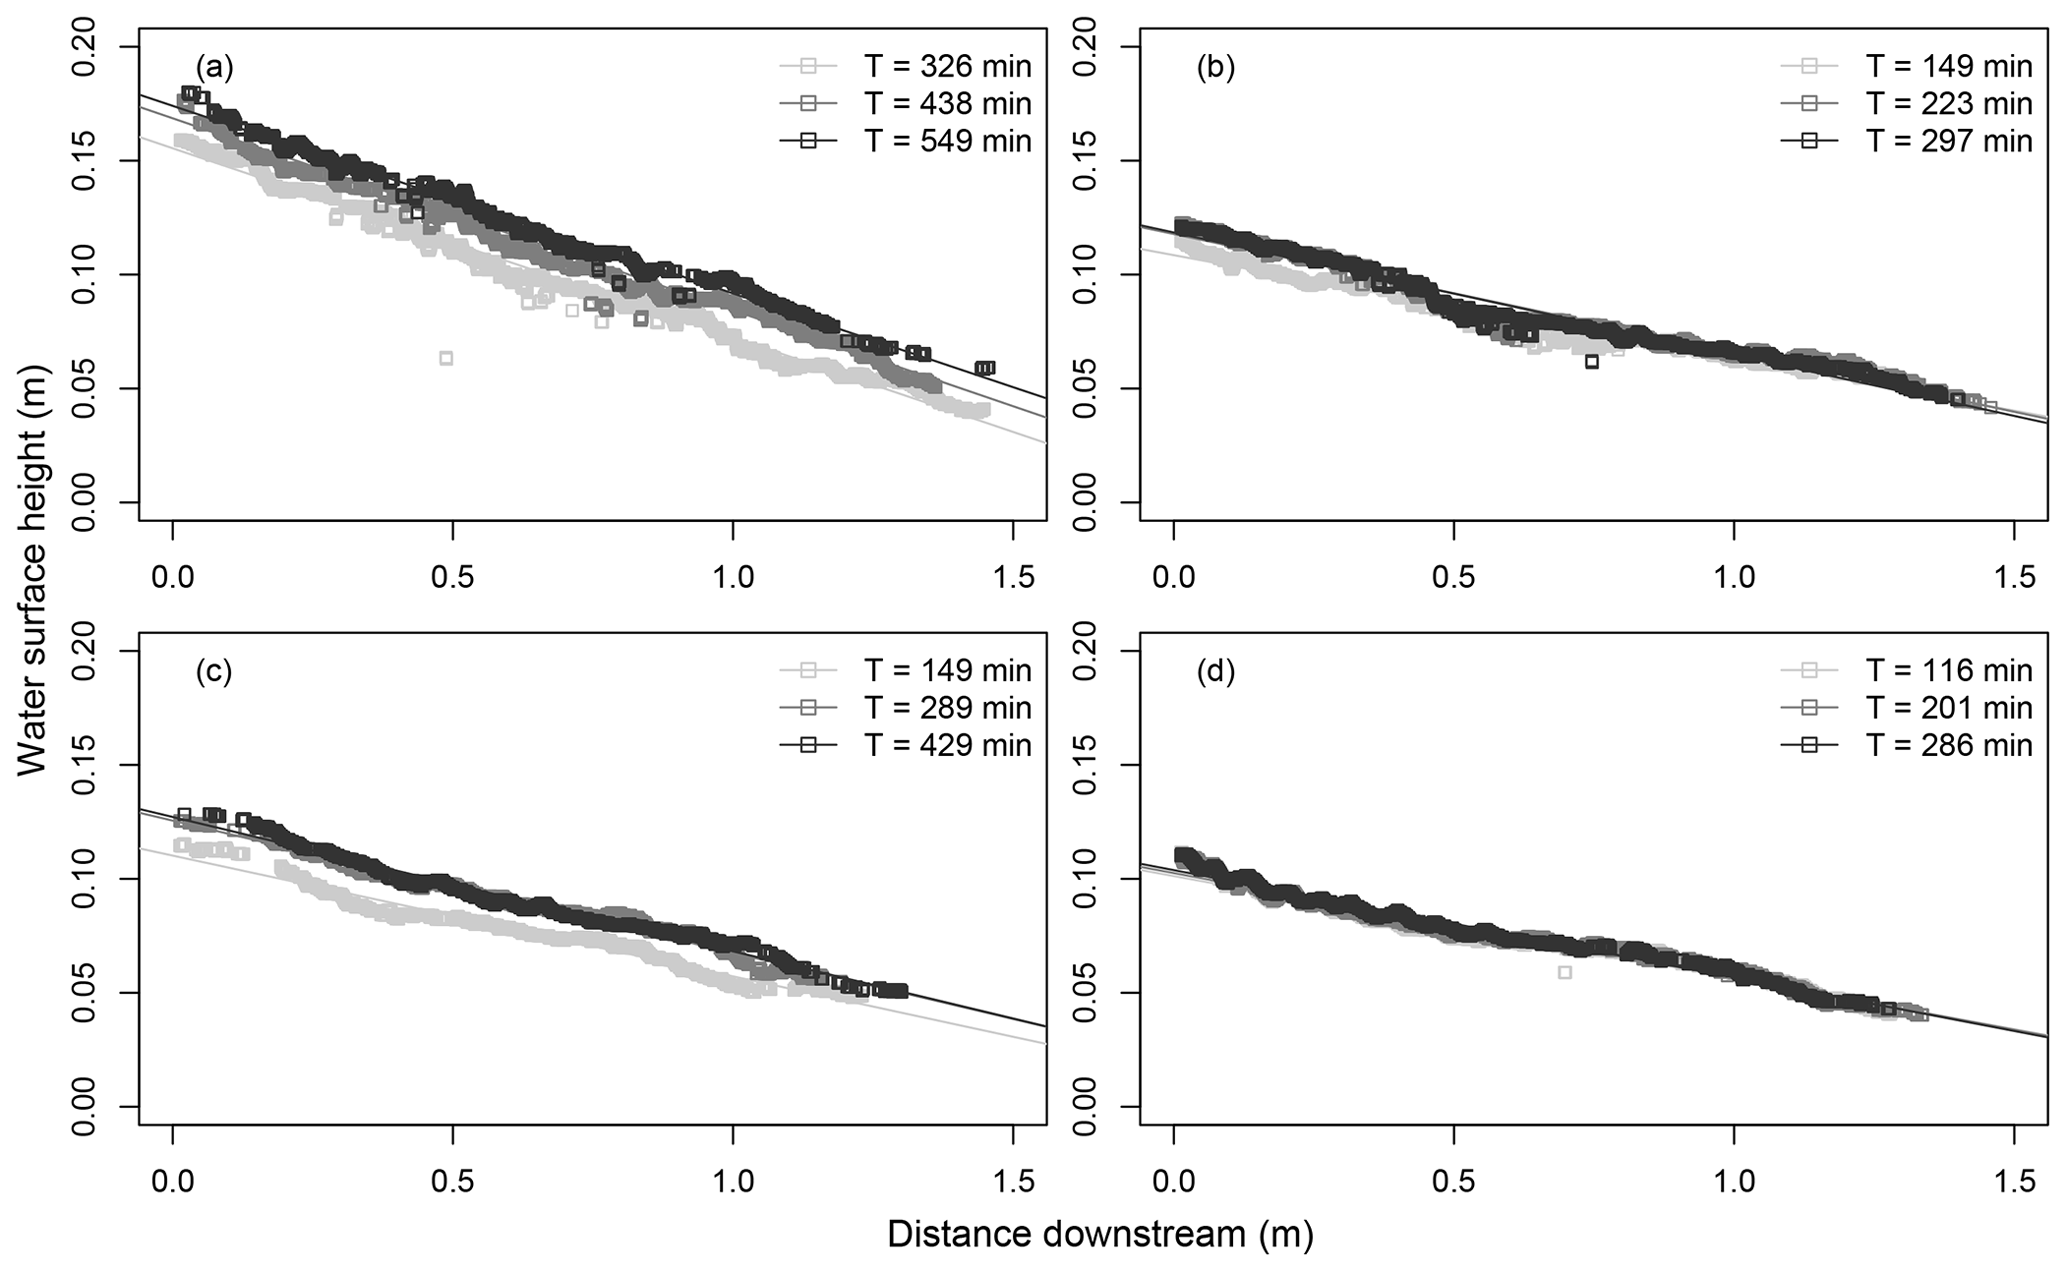
Figure 5Example water surface profiles, and regressions used to derive slope, for experiments (a) GSDbroad 100L, (b) GSDbroad 200H, (c) GSDnarrow 100L, and (d) GSDnarrow 200H. Times given in legend correlate to the onset of output, approximately halfway through the experiment, and the end of the experiment.

Figure 6Distribution of slope values from the onset of transport onwards. Plots separate experiments by relative sediment concentrations of (a) 1 and (b) not 1 (i.e. 0.5 or 2). Text indicates sediment feed rate (low supply = 1 g s−1, high supply = 2 g s−1).
There is a substantial difference between the distribution of slopes for GSDbroad and GSDnarrow under 100L conditions; GSDbroad organised to a mean 42.7 % higher than GSDnarrow (Fig. 6). Similarly, for twice the relative sediment concentration (i.e. 100H), a clear separation exists between the distributions of slopes formed by GSDbroad and GSDnarrow, albeit with a lower difference between the two; the mean slope of GSDbroad is 22.1 % higher. In contrast, at higher discharges but the same relative sediment concentration (200H) the slopes for both sediment feed rates are distributed about a lower mean (GSDbroad: 0.0492 m m−1, GSDnarrow: 0.0452 m m−1), and substantial overlap occurs between the lower bound of GSDbroad and the upper bound of GSDnarrow. The mean slope value decreases for both grain mixtures at lower feed rates and higher discharge (200L), although it decreases more sharply for GSDbroad (0.0497 m m−1) than GSDnarrow (0.0428 m m−1), and it occupies a similar distribution as that of 200H. Mean slopes are given in Table 1, and differences resulting from changes between run conditions for the same grain size distribution are shown in Table 2.
Table 1Mean slope values and standard deviations, for the eight experiments reported here.

Table 2Changes in mean slope for the column name experiment, given relative to the row name experiment, for GSDbroad and GSDnarrow respectively. Values are given in %.

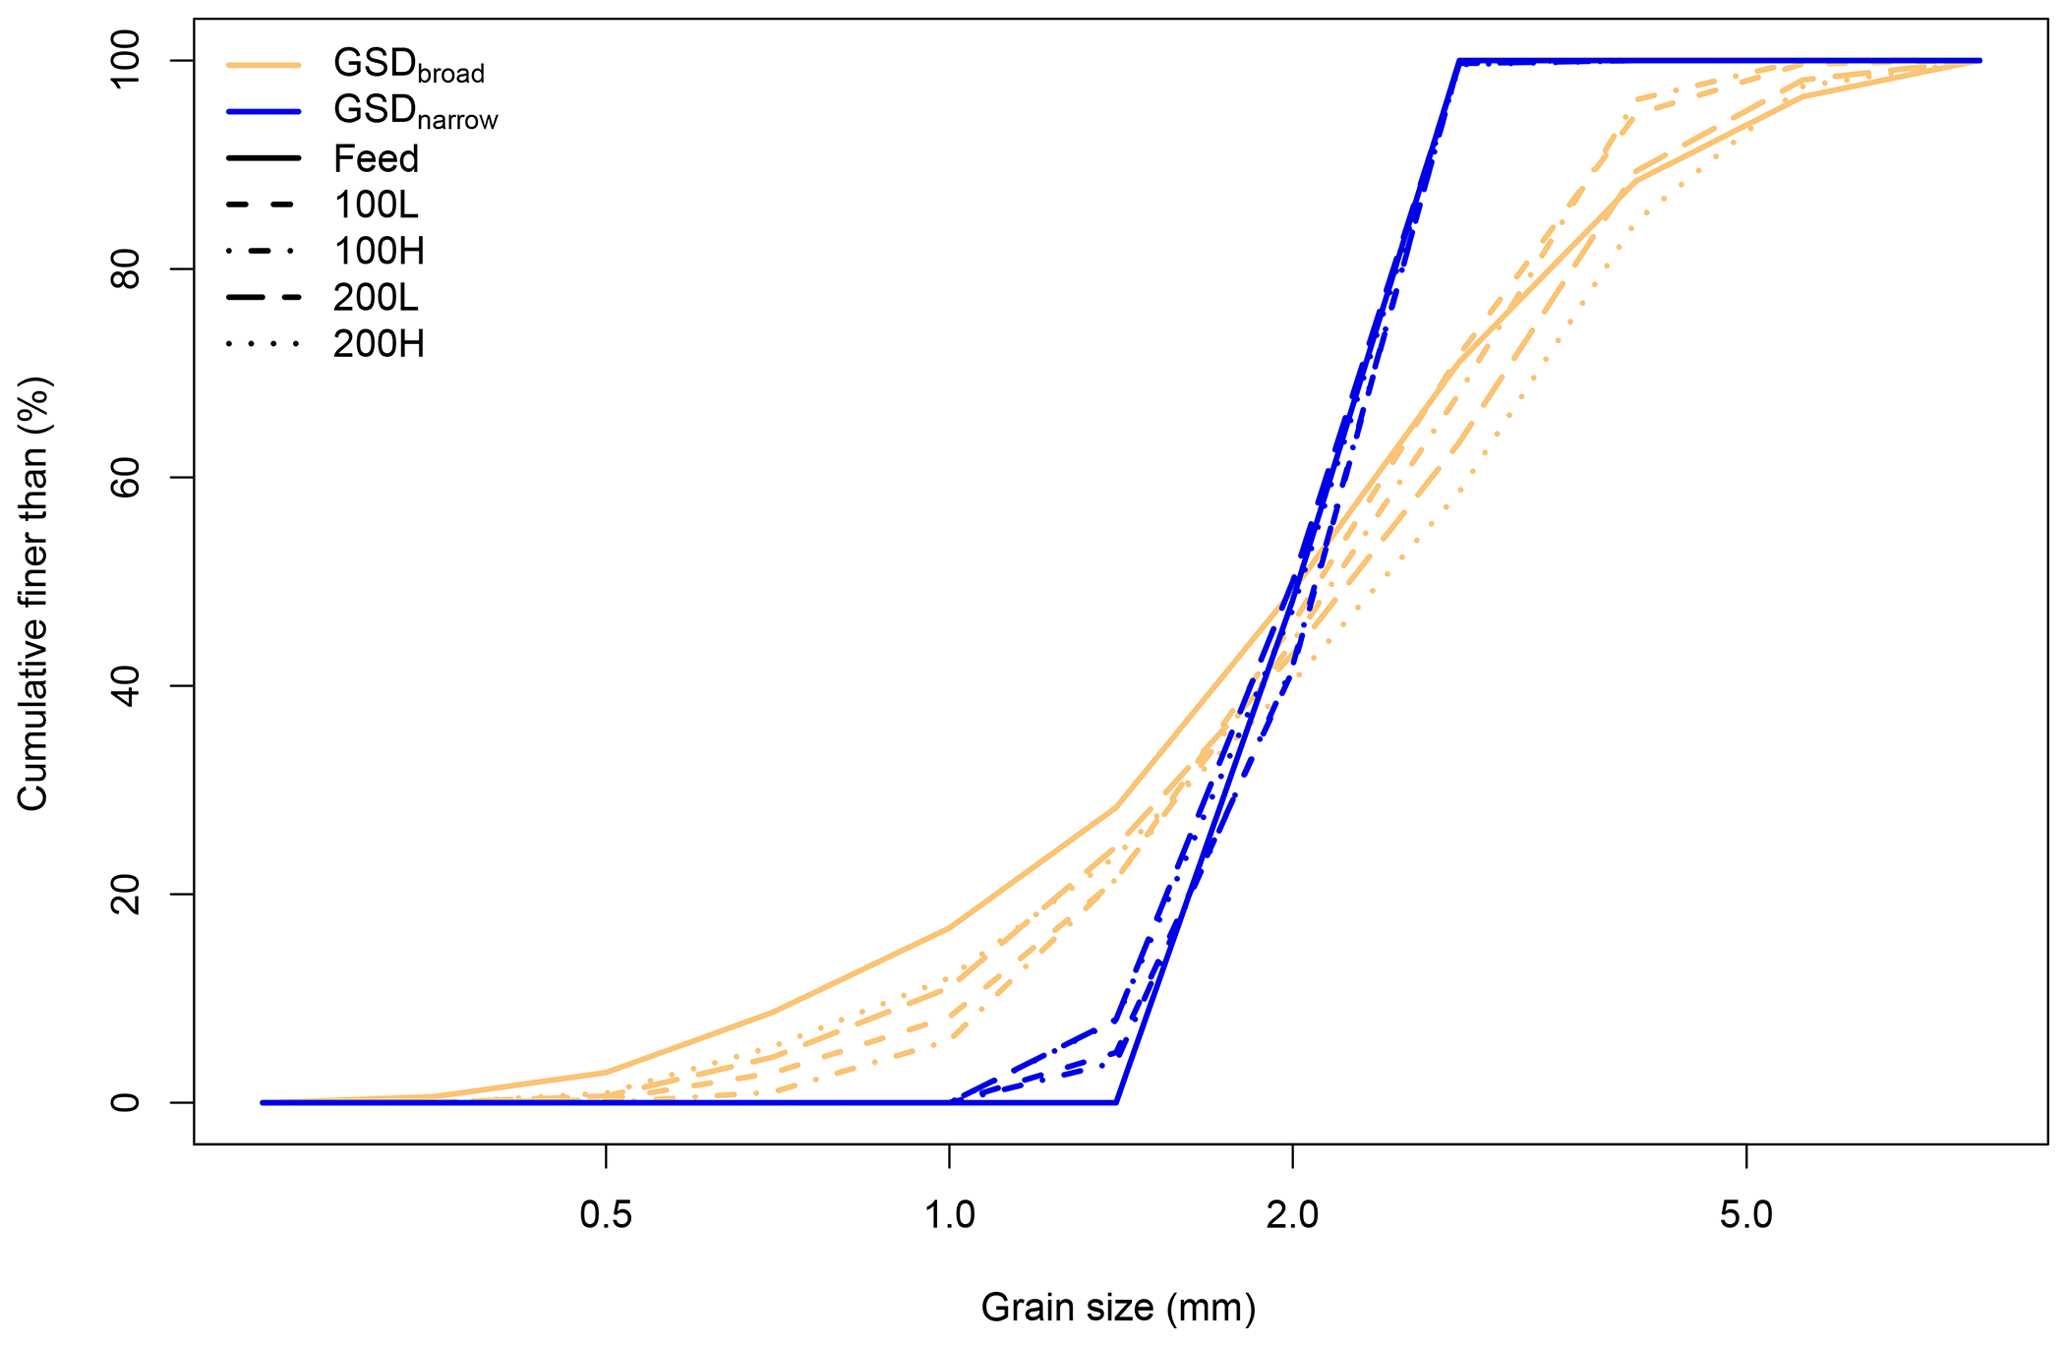
Figure 7Size distributions of material output across the length of each experiment. Original grain size distributions are also provided.
Sediment output rates show a decrease in the proportion of sediment storage in response to increases in discharge (Table 3). For both grain size distributions, more material is stored at lower discharges, resulting in steeper-sloped deposits. Doubling the feed rate results in both systems retaining a higher proportion of sediment within the system at 100 mL s−1, although this effect is more prominent in GSDbroad: 59.3 % to 91.5 % and 27.1 % to 33.6 % for GSDbroad and GSDnarrow, respectively. However, when discharge is increased, regardless of feed rate, the two systems behave more similarly both with respect to feed rate and with each other. Here, 16.3 % and 18.3 % of material is stored for GSDbroad under low and high feeds, respectively, and only 9.4 % and 8.6 % for GSDnarrow. At higher discharges and higher sediment supply rates, the onset of transport occurs earlier regardless of grain size distribution (Table 4). In addition, output starts later using GSDbroad for all experiments barring 200H, where transport begins at almost the same time.
Table 3Output of sediment during each experiment, from the time sediment output occurred. The proportion of sediment output is relative to the volume input over the same time span.
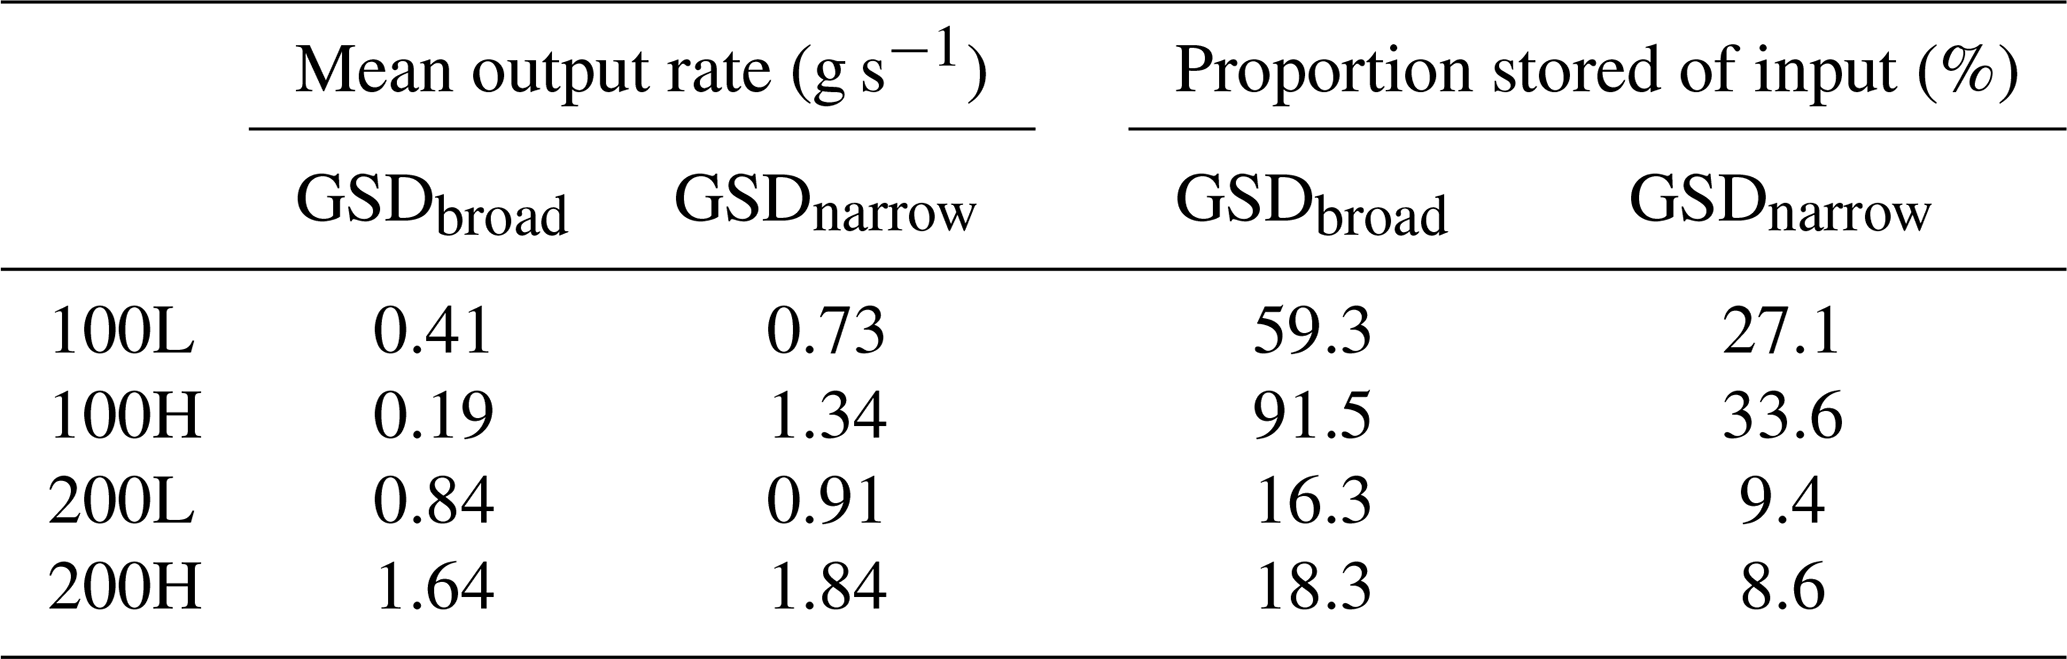
Table 4Timing of the onset of transport, given in minutes from the start of the experiment.

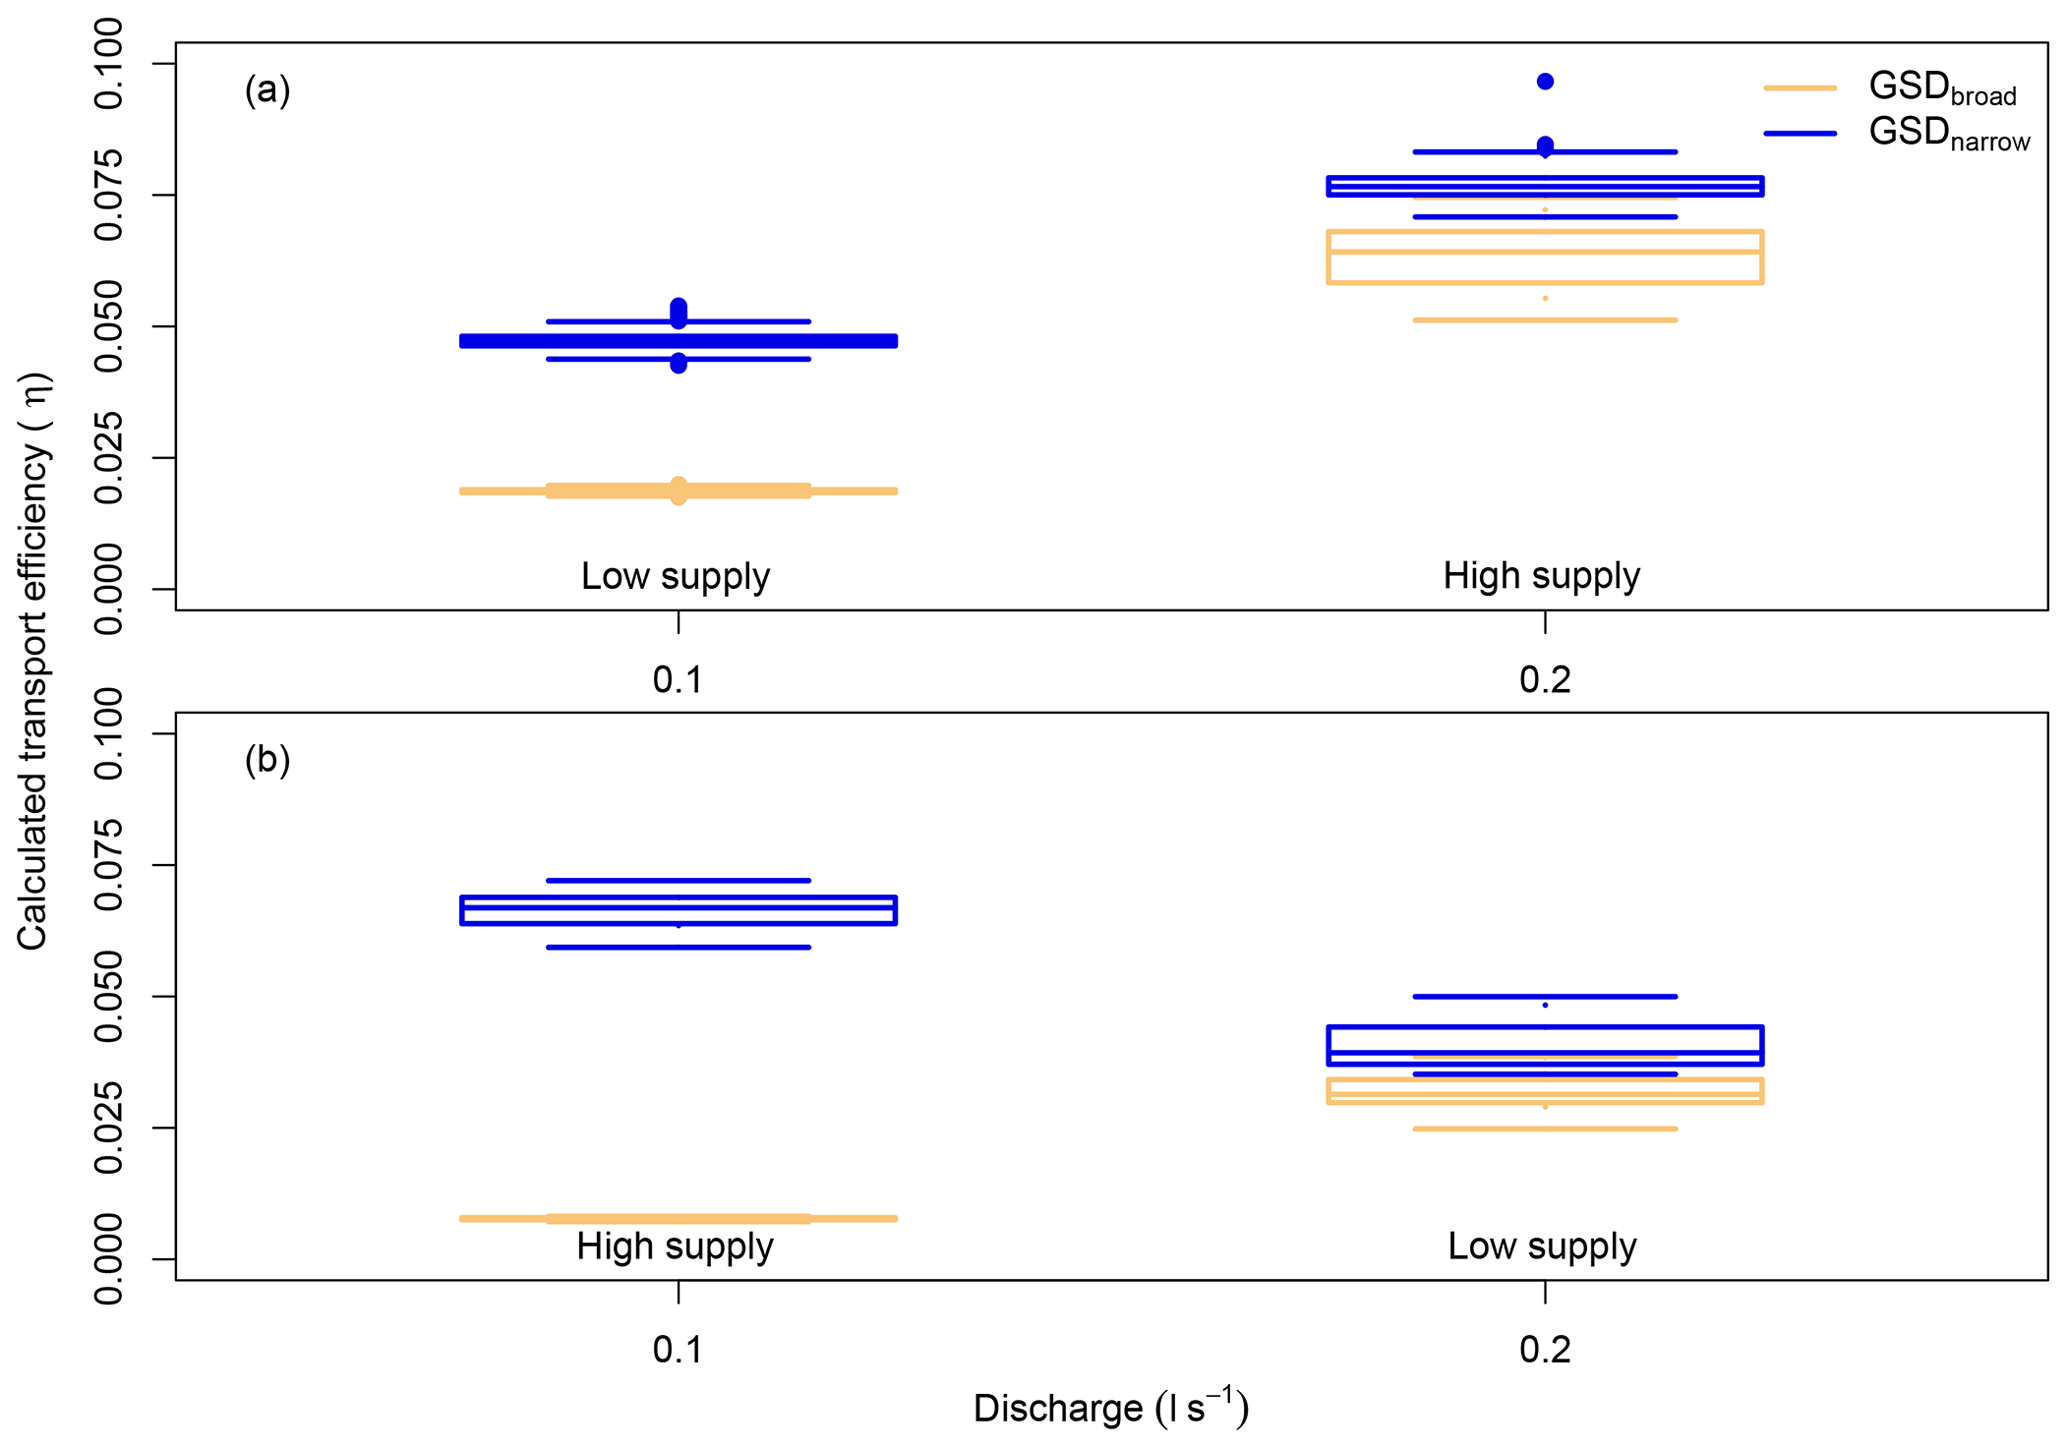
Figure 8Distribution of transport efficiencies, calculated using Eq. (3). Plots separate experiments by relative sediment concentrations of (a) 1 and (b) not 1 (i.e. 0.5 or 2). Text indicates sediment feed rate (low supply = 1 g s−1, high supply = 2 g s−1).
The distributions of the output material show a variable agreement between the input load and the output material (Fig. 7 and Table 5). For GSDbroad the D50 of the output is coarser at all discharges, whereas the D84 is finer at 0.1 L s−1 and coarser at 0.2 L s−1. The output mixture also only equals the feed σ at high feed rate and discharge. In contrast, GSDnarrow has a slightly higher output D50 at low discharge and finer at high discharge, with an almost constant D84. In addition, the σ is always higher than the feed rate. This, caused by the addition of a fine tail, is an artefact of the rotary feeder used in these experiments: the action of the rotating feeder pipe crushed a small amount of sediment as it was input into the flume. Overall, however, there is strong agreement between the feed and output grain mixtures.
Table 5Grain size statistics of output material, averaged over the total output mass and given in millimetres (mm).
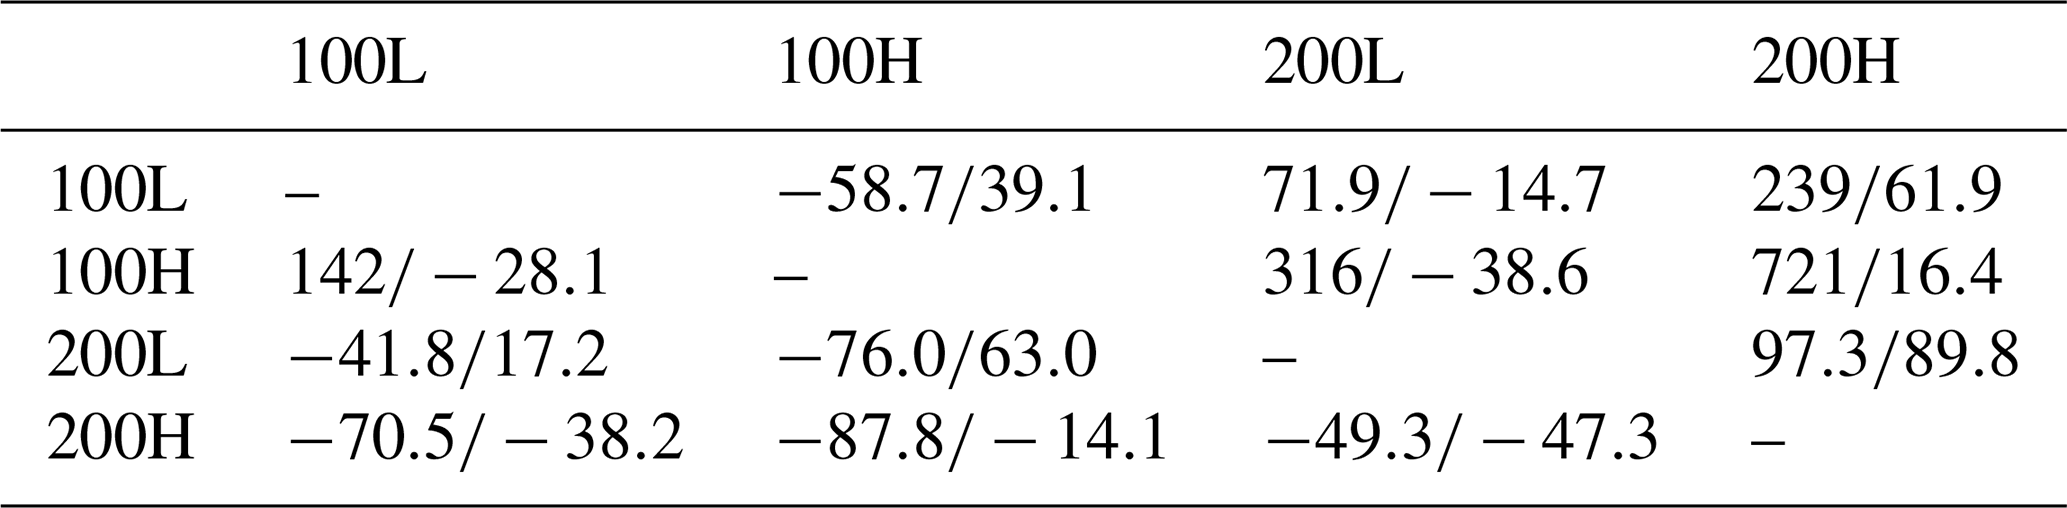
Three key observations can be made regarding the distribution of transport efficiencies (Fig. 8). First, the distribution of calculated transport efficiencies of GSDbroad are consistently lower than those of GSDnarrow (Table 6), following from the differences in slope reported above. For example, the mean transport efficiency of GSDnarrow is 154 % greater than GSDbroad for experiment 100L. Second, increasing water discharge, for a given feed rate, increases the efficiency of both grain size distributions except for GSDnarrow under low feed, where a decrease is observed (Table 7); efficiency for GSDbroad is 17.2 % higher under 100L than 100H. Third, increasing feed rate, for a given discharge, increases the efficiency of both grain size distributions except for GSDbroad with low discharge, where a decrease is observed (Table 7).
Table 6Mean transport efficiencies and their standard deviation with the number of observations (n) of the experiments.
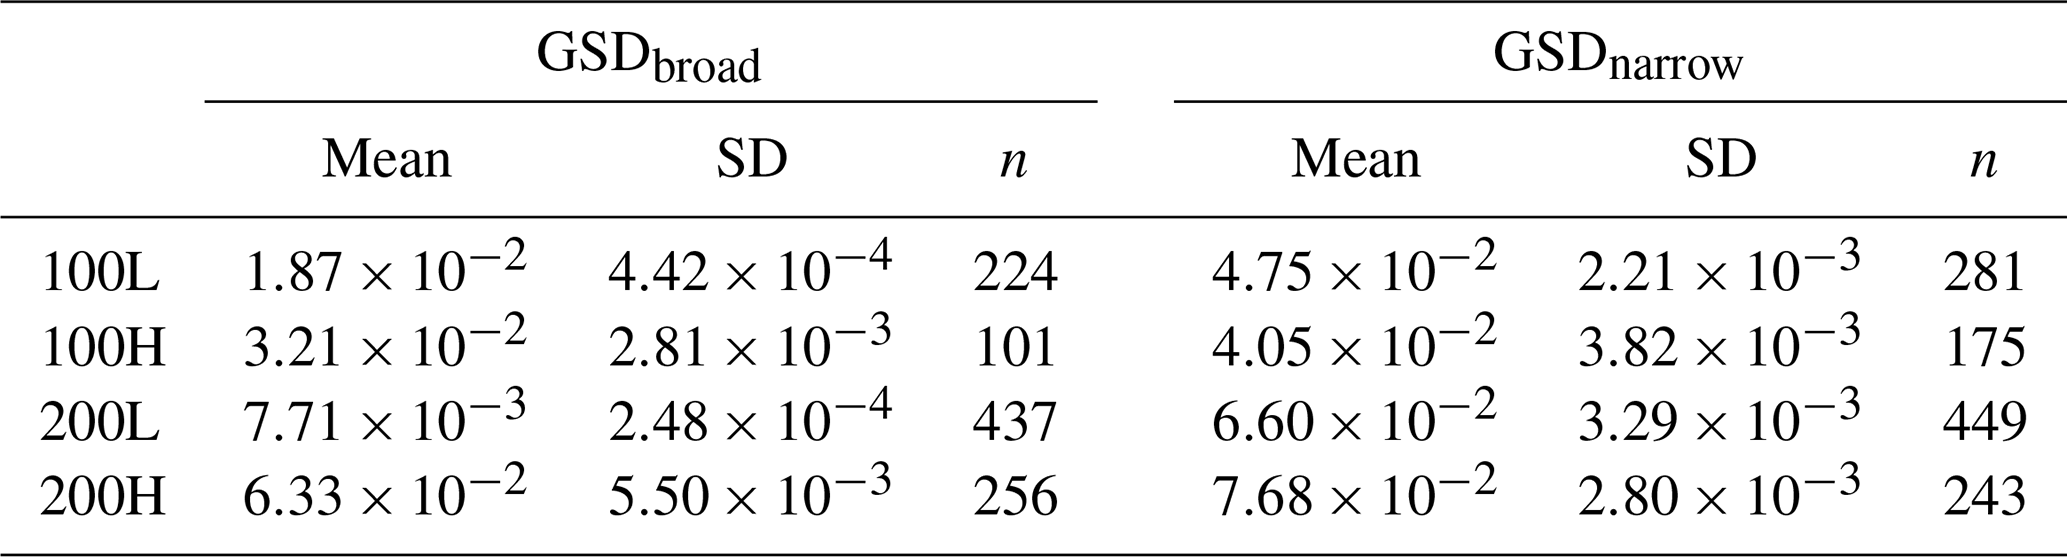
Table 7Changes in mean transport efficiency for the column name experiment, given relative to the row name experiment, for GSDbroad and GSDnarrow respectively. Values are given in percent (%).
The mean slope values were also used to calculate the reference shear stress (τr) necessary to entrain the D84 using the approach of Wilcock and Crowe (2003):
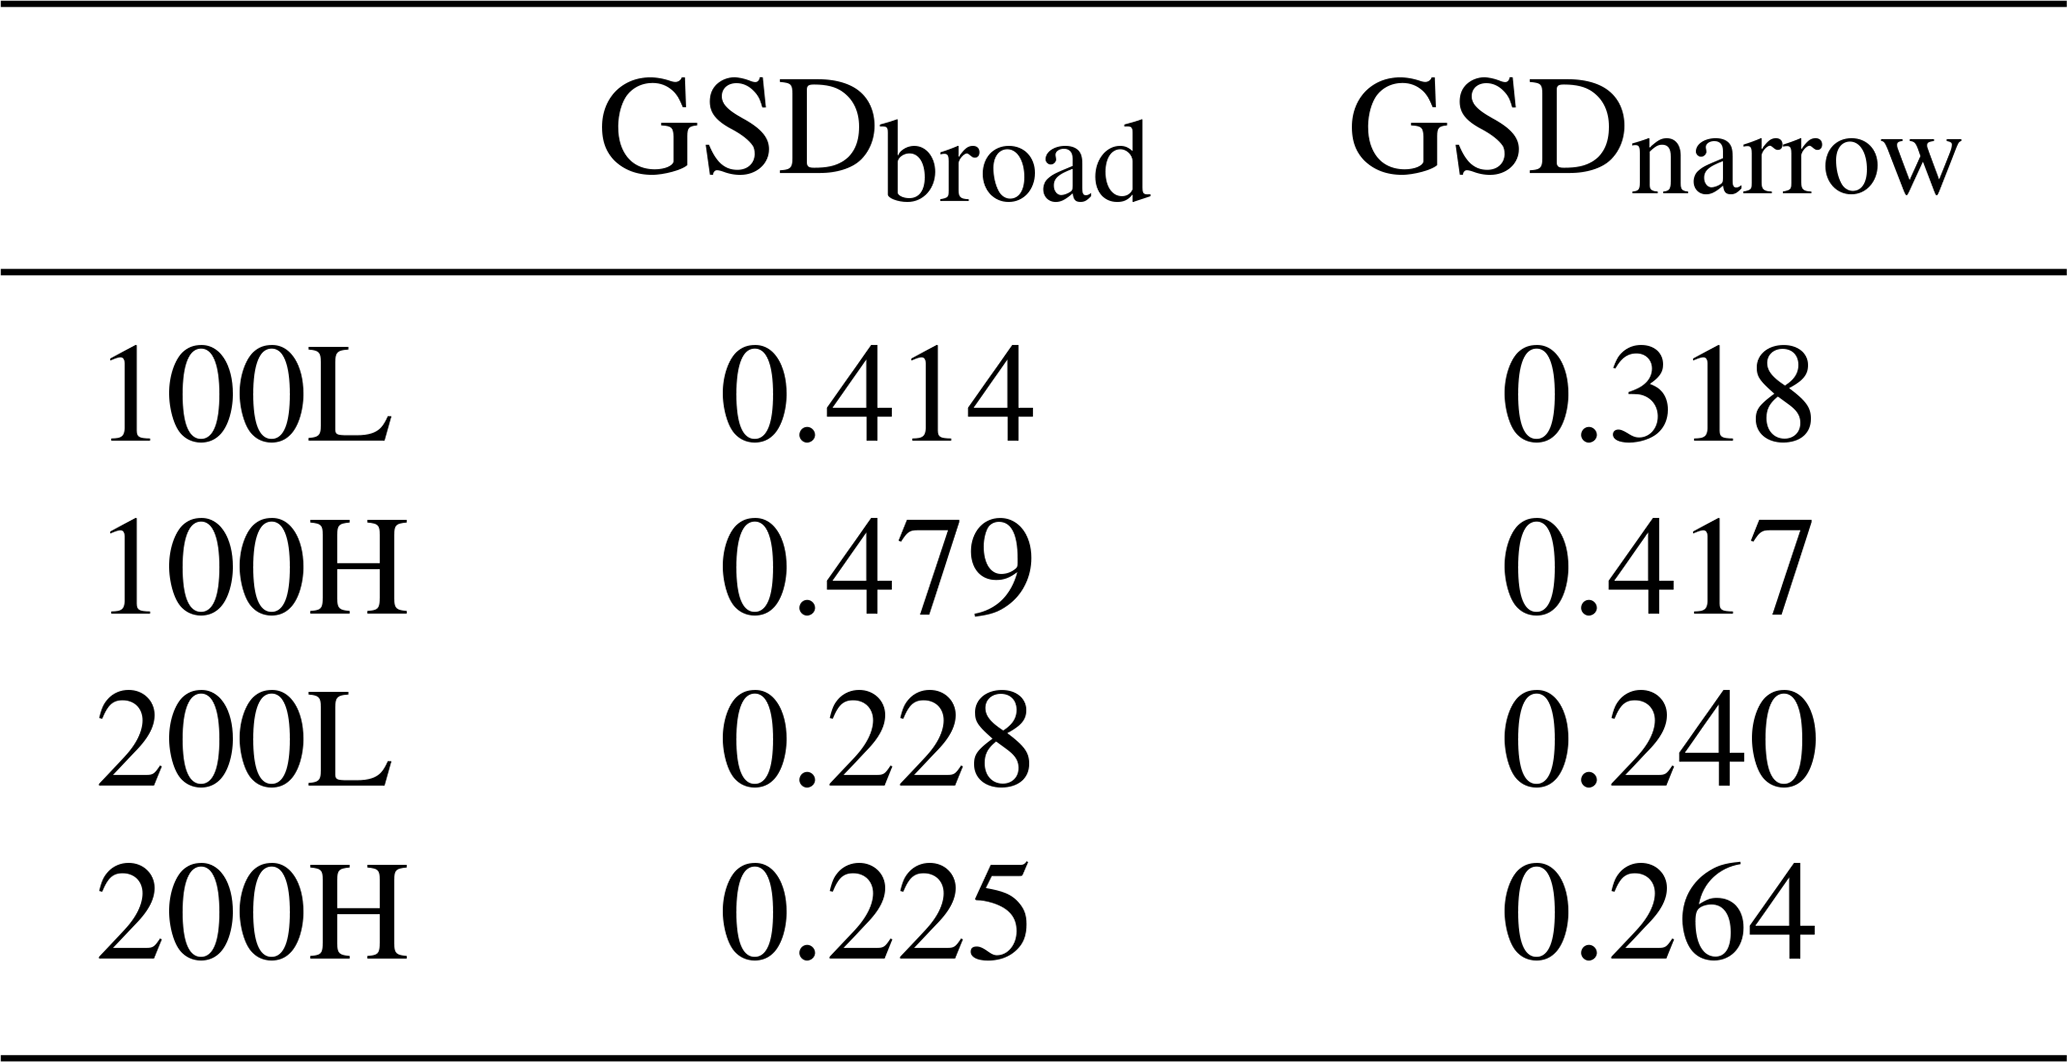
where τrs50 is the reference stress for the median surface grain size (D50), and b is an exponent of value 0.67 when i is larger than the mean surface grain size. Equation (4) produces a shear stress that is 48.1 % greater for entrainment of the D84 than the entrainment of the median in GSDbroad and a shear stress that is 15.5 % greater for GSDnarrow. This value is static for each mixture, solely based on the grains comprising the mixture and not on deposit characteristics, slope, or bed state. We also calculated the mixture mobility transition point () from Recking (2013), which is adapted from Recking (2010), using
where S is energy slope, and the transition point represents the Shields stress where partial mobility transitions to full mobility (Table 8). GSDbroad has substantially higher values for both low and high feeds (0.414 and 0.479, respectively) than GSDnarrow at low discharge (0.318 and 0.417), but they decrease at higher discharges (0.228 and 0.225) and approximate those of GSDnarrow (0.240 and 0.264), albeit slightly lower in value. That is, both mixtures exhibit similar transitions between partial and full mobility under the higher discharges, but GSDnarrow remains substantially lower at lower discharges.
In addition, the experiments also demonstrate differences in the morphologies, particularly centred around the form and behaviour of bars in the flume. The full suite of evidence is available in the supplemental videos submitted with this paper, but key frames are also included here. The bars formed using GSDbroad seem to form from the coarser end of material and exhibit greater curvature, whilst those of GSDnarrow form bars that deflect flow to a lesser extent, which are texturally indistinguishable from the bulk mix. At lower discharges, both grain size distributions exhibit higher numbers of bars with lower wavelengths, with GSDbroad typically organising to shorter wavelengths than GSDnarrow (Fig. 9a and c). At higher discharges, the number of bars decreases for both mixtures and their wavelengths increase to compensate, with GSDbroad continuing to exhibit a shorter wavelength (Fig. 9b and d). We also observed the occurrence of erosional events that we will refer to as “thalweg sweeps”, presented as a series of frames in Fig. 10 and also observable in the supplemental videos. During these events, the thalweg laterally erodes through the adjacent bar and then either remains on the new side or migrates back to its original position. These bar sweeps do occur in both grain mixtures; however, they are relatively limited in their frequency and magnitude in GSDbroad and are a more defining feature of the morphodynamics of GSDnarrow.

Figure 9Example images of bed state taken from GSDbroad at low (a) and high (b) discharge, and GSDnarrow at low (c) and high (d) discharge.
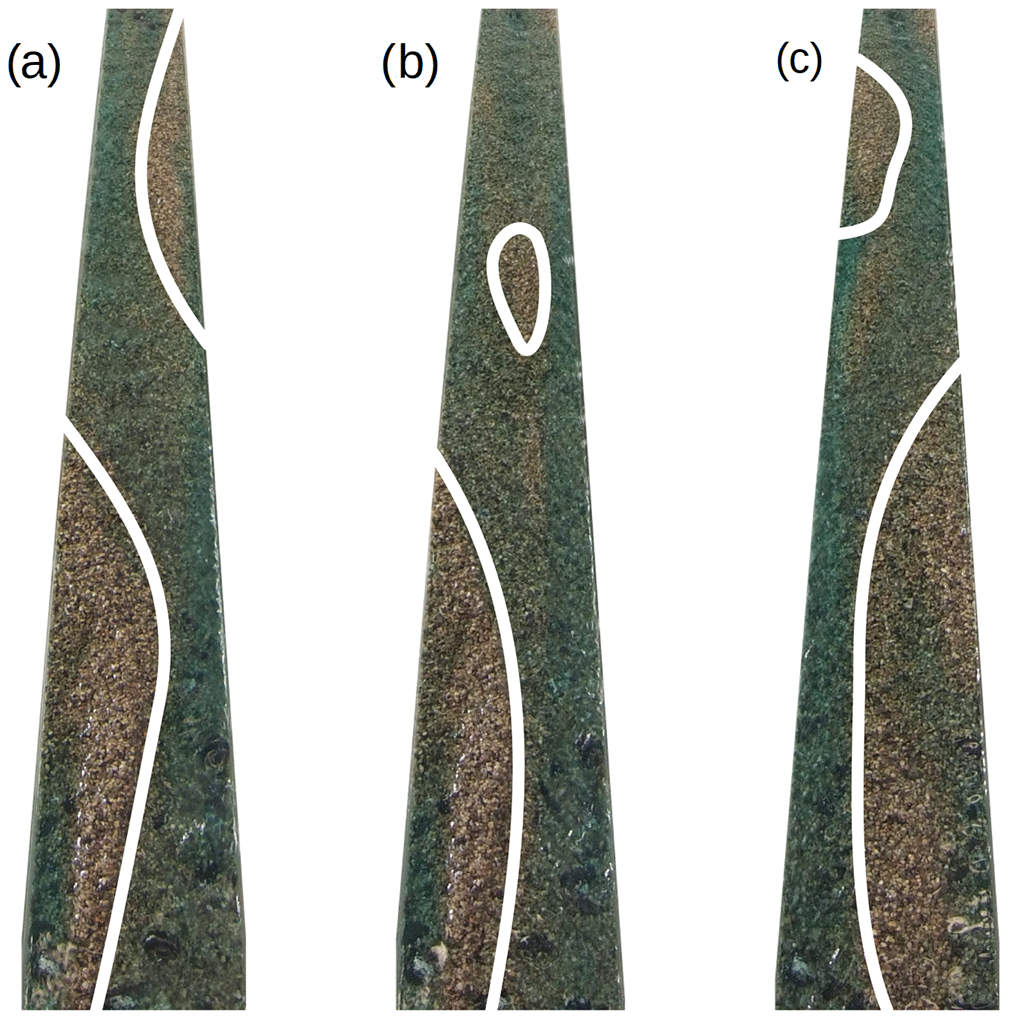
Figure 10Three frames taken from the beginning, middle and end of a thalweg sweep event from the left side of the flume to the right and resulting in a switching of the thalweg position, in experiment 200H using GSDnarrow. These frames correspond to approximately 28 to 30 s of the accompanying video.
The results of these experiments clearly demonstrate that the range of grain sizes present in the bed material and load exerts first-order control over self-formed deposition, and it is therefore inappropriate to simply use the median surface grain size in order to characterise the system under all conditions. The extent of this influence, however, varies with the boundary conditions under which the experiments are conducted. At lower discharges, differences between the two grain size distributions can be attributed to the relative difficulty of the channel to mobilise the larger grains, thus it is the volume of supplied material that influences the efficiency of transport. At higher discharges, the difference in behaviour between the two mixtures decreases as the mobility differences also decrease.
4.1 Differential mobility
The difference in mobility varying alongside discharge is shown by our primary response variable, slope. Slope acts as an indicator of the system's ability to transport the material supplied to it, as mediated by the energy supplied to it (Mackin, 1948; Lane, 1955; Church, 2006; Eaton and Church, 2011). If we were to predict behaviour of the systems from the Lane and Church relations (Eqs. 1 and 2), we would assume that both grain size distributions would behave in the same manner. Additionally, those experiments of the same relative sediment concentration (100L and 200H) would have the same values of slope. Further, where sediment concentration was increased or decreased, we would expect commensurate increases or decreases in slope, respectively. However, one set of systems (i.e. those of the broadly graded GSDbroad) consistently organise to higher slopes and lower transport efficiencies than those for the more narrowly graded (i.e. GSDnarrow) systems for each experimental condition. As all systems were continuously accumulating, static sediment surface armouring (e.g. Sutherland, 1987; Parker and Sutherland, 1990; Gomez, 1994) could not occur due to the suppression of selective transport and subsequent equivalence between the bed surface and sediment feed grain size distributions. Instead, here the bed surface resembled the bed states that Iseya and Ikeda (1987) and Lisle et al. (1991) observed, in which the mixture is laterally organised. Bennett and Bridge (1995) also observed a lack of bed texture adjustments under aggrading settings, when the accumulation is induced either by flume slope or feed rate changes. Therefore, we believe that the observed differences in slope cannot be attributed to differing degrees of surface armouring across the bed surface.
A potentially critical explanation for this disparity is that equal mobility does not apply to all of the bed sediment all of the time. For example, Andrews (1983) found equal mobility applied only to sediment finer than about the bed surface D84 in their field study, and nearly all of the data on bed mobility published by Haschenburger and Wilcock (2003) showed similar relative stability of the largest grains at even the highest shear stresses. Mixtures do approach equalised mobility under higher entraining stresses, although larger grains are still entrained less frequently and travel less distance (Church and Hassan, 1992). We believe that this suggests that the size of the largest sediment in the bed may determine the deposition threshold for a mixture, at least for those situations in which competence controls sediment deposition, not sediment transport capacity. The implication of which is that the gradient of self-formed alluvial deposits is likely to be related to the mobility of the largest sediment in transport not the median grain size, as evidenced in bimodal fan experiments (Reitz and Jerolmack, 2012; Delorme et al., 2017).
According to the conventions established by Lane (1955) and Church (2006), both of our grain size distributions had the same sediment calibre, so why did they not equilibrate at the same slope and achieve the same transport efficiency? The average size of the sediment feed calibre is almost identical for both GSDbroad and GSDnarrow. While we can explain the failure of Eq. (1) as stemming from its original intention to be used as a qualitative guide for thinking about channel grade, Eq. (2) is based on the existing semi-empirical representations of bed sediment entrainment, so the discrepancy between Eq. (2) and the results in Fig. 8 points to a more fundamental problem. Under these conditions, both mixtures do not exhibit the same mixture mobility because of the distribution's relationship with the threshold of motion; both mixtures are not equally mobile irrespective of discharge. Simply put, these results clearly indicate that D50 is a poor choice for the characteristic grain size, at least when considering the processes forming (i.e. aggrading) alluvial deposits at lower discharges (i.e. the majority of the time), rather than those eroding them or under equilibrium conditions. The use of these equations confirms that the D50 is only appropriate under equal mobility conditions. Our preliminary analysis suggests that some representation of the coarse tail is probably more appropriate (such as the D84, which is commonly used in flow resistance equations (e.g. Lenzi et al., 2006; Ferguson, 2007; Recking et al., 2008)), under the partial mobility conditions shown during some of these experiments.
At a basic level, the observed difference in slopes is associated with the differential ability of two experimental systems to transport sediment, which in turn is related to the relative thresholds of motion of the largest grains. Curran and Wilcock (2005) observed a gravel–sand mixture organising to lower slopes in response to increased proportions of sand, implying that the higher sand presence decreased the critical shear stress necessary to transport coarser material, a common feature in bed organisation studies (e.g. Iseya and Ikeda, 1987). When the bed is organised as such, the variance of force exerted upon the grain and thus the likelihood of entrainment increases (Schmeeckle et al., 2007), hence the lower deposit slope and higher mobility. Here we infer that the inverse is in operation, with the presence of coarser grains decreasing the overall transport rate by increasing the entraining stresses of the mixture in a similar manner to their behaviour in degrading settings (Church et al., 1998; MacKenzie and Eaton, 2017), antithetical to the influence of sand. That is, the presence of coarse grains acts in a manner similar to those in kinematic waves and traction clogs in slowing the overall bed load motion (Leopold and Wolman, 1957; Moss, 1963; Langbein and Leopold, 1966; Ashmore, 1991).
Based solely on the differences in reference stress values (Eq. 4), we would expect a fixed difference in slopes between the two grain mixtures. However, our observations of the differential system state responses (i.e. slope) show that the degree of this difference changes with discharge. Our calculations of the transitional Shields stress, from Recking (2013), indicates that this value changes alongside discharge, as a product of slope. The differences in slope at low discharge and similarities at high discharge indicate the importance of the absolute mobility of the bed material, and the coarser fraction, in conjunction with its relative mobility. That is, if the material is subjected to a larger fluid force (i.e. higher discharge), it performs the same role as removing those grains which cause the immobility, and hence a convergence in behaviour.
The threshold calculation used in Eq. (5) invokes the partial and full mobility conditions under differing flow strengths by Wilcock and McArdell (1993). Although we cannot calculate a shear stress, given the lack of water depths, it is a useful indicator of the state of the system at a more generic scale, regardless of the actual values of . This separation between transport regimes at low and high discharges is also similar to the observation of the three phase transport models of Ashworth and Ferguson (1989) and Warburton (1992), where full mobility is achieved above a threshold discharge following the cessation of a given influence. However, the increased transport rates are not generated through the destruction of previously organised structures (e.g. Laronne and Carson, 1976; Cudden and Hoey, 2003; Recking et al., 2009). Instead the difference is sourced from an increase in the maximum grain size entrainable by the flow, and the likelihood of that grain's entrainment. The fact that we see a broadly graded mixture (GSDbroad) acting in a manner similar to one that is narrowly graded (GSDnarrow) at higher discharges suggests that Eq. (2) is applicable when there is equal sediment mobility as the characteristic grain size approaches the median.
We also observed two further phenomena that may contribute to the observed output distributions. First, the finest material would often be found at the base of the flume during preparation for the next run, having filtered through the coarser matrix; a phenomenon limited to GSDbroad. The hiding of this finer material through vertical sorting explains the observed differences in the fine tail (Fig. 7) as well as the constant coarser D50 for GSDbroad. Second, there was a degree of coarse material deposition at the mouth of the feeder. However, as shown by the similarities of the output and input D84 (Table 5), this only affected GSDbroad at the low discharges, presumably when these grains were not mobile throughout the mixture, regardless of their deposition upstream. Therefore, we believe the mobility differences are systematic between the two distributions.
4.2 Bedform and dynamics
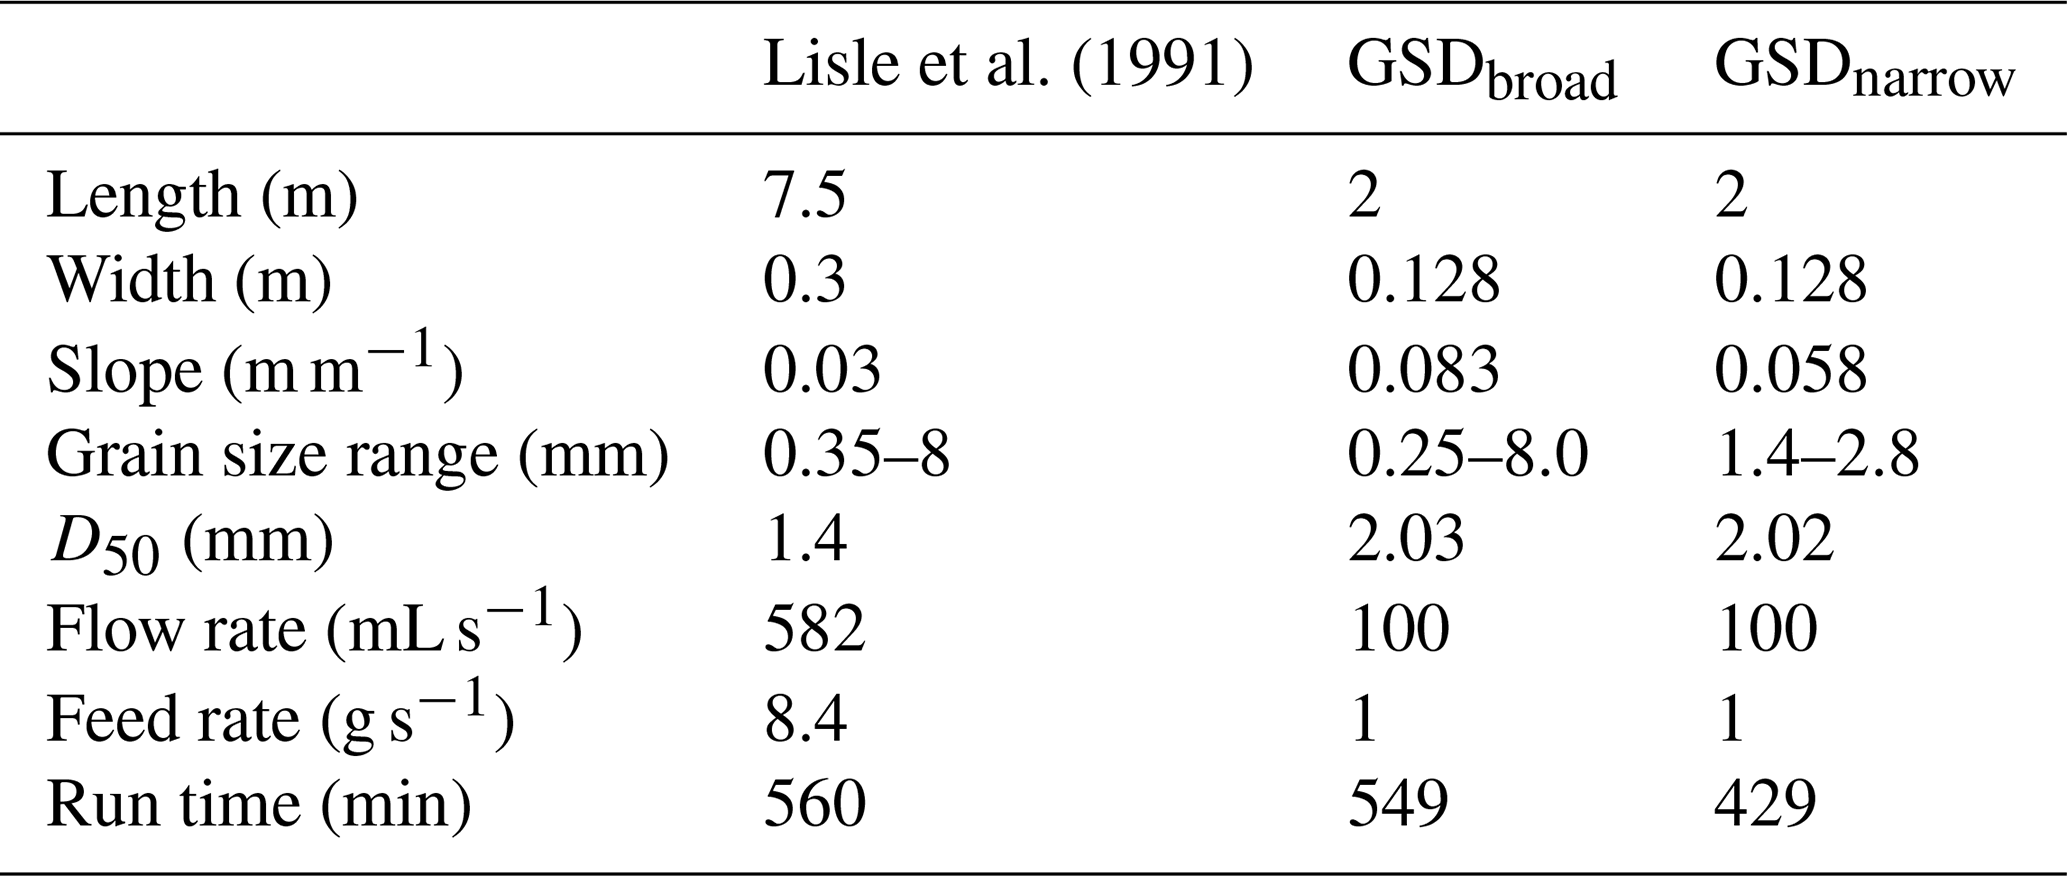
The differences in morphodynamics extend beyond reach-average 1-D parameters like depositional slope and transport efficiency. Our observations of the bed dynamics have highlighted the important role that surficial organisation plays in controlling channel morphology and influencing sediment transport rates. Surface organisation is a frequent response of channels to increased sediment supply in order to maintain some sediment coherency (Lisle and Hilton, 1992; Kasai et al., 2004; Pryor et al., 2011). The alternate bar morphodynamics we observed during some runs have been previously observed (Table 9), arising from unequal stresses across the bed (Lanzoni, 2000). Under a similar grain size distribution to GSDbroad, Lisle et al. (1991) observed the formation of stationary (non-migrating) lateral bars with the bed surface separated into congested and smooth zones, influencing transport paths.
Table 9Flume dimensions and run conditions for Lisle et al. (1991) and the two 100L experiments included here.
Bedforms can influence sediment transport efficiency through the dissipation of energy and increased channel stability (Cherkauer, 1973; Hey, 1988; Prancevic and Lamb, 2015), and the bar characteristics are strongly linked to the maximum size of sediment in the bed material here. In GSDbroad, bars were more persistent in time and space than in GSDnarrow due to the importance of large grains as stabilising features for bars. In the case of GSDbroad the largest grains clearly deposited first, creating a locus of deposition around which the bar head formed, allowing additional sediment to accumulate in its wake (Leopold and Wolman, 1957; Ashmore, 1991; Ferguson, 1993). The bars formed during GSDnarrow were comprised of virtually the same size sediment, which can be entrained over a narrow range of shear stresses. As a result, the whole bar may be entrained at a similar shear stress, making these features more transient, and reducing their overall effect on bed stability as their relative impermanence means that the flow can freely move through them (Figs. 9 and 10). It is important to note that the stabilisation of the large grains in our experiment GSDbroad was not the result of jamming, as described by Church (2006). The size of our flume was such that the ratio of the flume width to D84 was greater than 6, the jamming ratio proposed by Zimmermann et al. (2010), and it is thus solely the result of deposition.
The formation of lateral bars allows for the transport of bed load through the contraction of the channel width increasing unit stream power as flow is concentrated (Lisle, 1987). This organisation of the bed surface into zones of transport and deposition thus maximises the efficiency of the channel (Iseya and Ikeda, 1987; Ferguson et al., 1989) and enables the previously limited transmittance of sediment and the growth of the depositional lobe. The wavelengths of the bar forms we observed in higher sediment output experiments are longer than those of high sediment storage. Experiments by Pyrce and Ashmore (2003a, 2005), and a meta-analysis by Pyrce and Ashmore (2003b), demonstrated that the wavelength of bar spacing is a function of the transport lengths of bed load particles at channel-forming flows; therefore, the material is more mobile in higher wavelength reaches. Transport length is the distance between entrainment (τce) and distrainment (τcd); therefore, it is dependent on when the grain is deposited. Ancey et al. (2002) observed a type of hysteretic difference between these two thresholds, where the specific flow rate (and thus stress) necessary to induce deposition is lower than the entraining flow. Given the differences in entraining threshold between the mixtures, assuming that it is controlled by the coarse tail, it follows that the distraining threshold for GSDbroad will be higher than for GSDnarrow, such that a smaller decrease is needed to trigger deposition. Therefore, the systems can be characterised by the difference in behaviour of the coarse grains comprising the bar head loci (Pyrce and Ashmore, 2005). For the more equally mobile GSDnarrow, this is manifested in a decreased likelihood of deposition of these grains, triggering longer path lengths and greater bar wavelengths in the system. In other words, the likelihood of entrainment (P[τ>τce]) is greater in GSDnarrow, setting a lower overall deposit slope, whereas the likelihood of distrainment (P[τ<τcd]) is higher in GSDbroad, decreasing transport length. This difference is reduced as discharge increases because the likelihood of entrainment increases, and distrainment decreases, for both mixtures but more strongly for GSDbroad, hence the similarity between values at higher discharges.
Were we to pinpoint the actual characteristic grain size of the material, we might expect the slopes to actually organise to the same values. For example, if we were to pair these distributions instead by a coarser grain (e.g. the D84), we might have observed more similar self-organised slopes. However, this view still assumes the same inherent grain class mobility across discharges, which is the theoretical basis behind Church (2006), merely shifted in favour of the larger grains contributing more relative stability. That is, each mixture still has different distributions of transport likelihoods; does the characteristic grain size actually represent enough of the bed processes that the overall system behaves in the same manner? If the lateral bars were composed of coarser material, with the same narrow gradation as GSDnarrow, the depositional slope and wider morphodynamics may be similar (i.e. general organisation), but the finer scale processes (i.e. sediment transport and meander wavelength) would not be. However, it might be the case that similar characteristic grain sizes are just an artefact of the experimental design, rendered irrelevant when boundary conditions are expanded to different ranges. Additionally, mobility differences can be more strongly controlled through channel widening and planform adjustments than allowed within this flume; thus, the importance of grain class thresholds are reduced as there are more options for resistance to be generated (Eaton and Church, 2004). Thus, the discussion of any one characteristic size is only useful within a given comparison, and it does not necessarily indicate a behaviour fundamental to self-formed channels but is merely the smallest partially mobile grain class (Wilcock, 1993).
We can therefore consider the systems generated by GSDnarrow as less stable on three accounts. Firstly, they developed at lower slopes and, as a result, were able to prograde more quickly due to reduced deposit volume. Secondly, the grains were more equally mobile due to a lower maximum threshold stress (i.e. smaller coarse fraction). Thirdly, the degree of surficial organisation was lower and bedforms were less persistent. The combination of these factors results in a system that does not need to concentrate flow in order to exceed threshold stress, despite the flow's lower slope and stream power, indicating its ability to transport sediment more efficiently than in experiments using GSDbroad.
The eight experiments presented here demonstrate a difference in the self-adjusted slope and morphodynamics of aggrading systems derived from the difference of their grain size distributions and mediated by the relative sediment concentration. According to the prevailing theory that the median grain size is predictive of channel behaviour, the systems described within this paper should have exhibited similar slopes and patterns of morphodynamics under the same boundary conditions. Instead, the deposit formed from the more widely graded distribution (GSDbroad) developed to a higher slope, with lower transport efficiency, and demonstrated a greater degree of surface organisation. We argue that this is the result of the large grains present in this mixture that exceed the competence of the flow, and they require channel narrowing in order to mobilise. Where these grains are absent (i.e. the narrowly graded GSDnarrow) the channel fails to organise to its most stable state (i.e. lateral bars with narrow thalweg) as regularly because of the more equally mobile sediment and bars. This difference decreases as discharge is increased (i.e. entraining stresses). Thus channel stability is linked not to the mobility of the median grain size, but to the mobility of the largest grains (e.g. D84). We therefore conclude that the difference in behaviour between these systems is driven by a competence limitation of the larger grains. These findings indicate that models that include sediment transport and conceptualise stability, such as regime models, need to consider the characteristic grain size as a coarser fraction than the median in order to more realistically replicate behaviour in aggrading systems.
Both the code and data used to create Figs. 2 and 4–8 are available online (https://doi.org/10.5281/zenodo.3626231; Booker, 2020).
Videos of the bed morphodynamics are available online; GSD1 corresponds to GSDbroad: Q100L (https://doi.org/10.5446/41771), Q200H (https://doi.org/10.5446/41772), Q100H (https://doi.org/10.5446/41773), Q200L (https://doi.org/10.5446/41774). GSD2 corresponds to GSDnarrow: Q100L (https://doi.org/10.5446/41775), Q200H (https://doi.org/10.5446/41776), Q100H (https://doi.org/10.5446/41778), Q200L (https://doi.org/10.5446/41777).
WHB collected and analysed the code and data used in the paper, drafted the article, and created the figures and tables; BCE organised, reviewed and edited the article.
The authors declare that they have no conflict of interest.
The authors would like to thank the reviewers for their comments and time, which we think have greatly improved the content and character of this paper. We would also like to thank Jens Turowski and the editorial board for their help. We are thankful to Lucy MacKenzie, David Adams, and Anya Leenman for the useful and insightful discussions regarding this work.
This paper was edited by Jens Turowski and reviewed by Angel Monsalve and three anonymous referees.
Ancey, C., Bigillon, F., Frey, P., Lanier, J., and Ducret, R.: Saltating Motion of a Bead in a Rapid Water Stream, Phys. Rev. E, 66, 036306, https://doi.org/10.1103/PhysRevE.66.036306, 2002. a
Andrews, E. D.: Entrainment of Gravel from Naturally Sorted Riverbed Material, Geol. Soc. Am. Bull., 94, 1225–1231, https://doi.org/10.1130/0016-7606(1983)94<1225:EOGFNS>2.0.CO;2, 1983. a, b
Andrews, E. D. and Parker, G.: Formation of a Coarse Surface Layer as the Response to Gravel Mobility, in: Sediment Transport in Gravel-Bed Rivers, edited by: Thorne, C., Bathurst, J., and Hey, R., Wiley, New York, 269–300, 1987. a
Ashmore, P. E.: Laboratory Modelling of Gravel Braided Stream Morphology, Earth Surf. Proc. Land., 7, 201–225, https://doi.org/10.1002/esp.3290070301, 1982. a
Ashmore, P. E.: How Do Gravel-Bed Rivers Braid?, Can. J. Earth Sci., 28, 326–341, https://doi.org/10.1139/e91-030, 1991. a, b
Ashworth, P. J. and Ferguson, R. I.: Size-Selective Entrainment of Bed Load in Gravel Bed Streams, Water Resour. Res., 25, 627–634, https://doi.org/10.1029/WR025i004p00627, 1989. a, b
Bagnold, R. A.: An Approach to the Sediment Transport Problem from General Physics, US Government Printing Office, Washington, D.C., 1966. a
Belgiu, M. and Drăguţ, L.: Random Forest in Remote Sensing: A Review of Applications and Future Directions, ISPRS J. Photogram. Remote Sens., 114, 24–31, https://doi.org/10.1016/j.isprsjprs.2016.01.011, 2016. a
Benda, L. and Dunne, T.: Stochastic Forcing of Sediment Routing and Storage in Channel Networks, Water Resour. Res., 33, 2865–2880, https://doi.org/10.1029/97WR02387, 1997. a
Bennett, S. J. and Bridge, J. S.: An Experimental Study of Flow, Bedload Transport and Bed Topography under Conditions of Erosion and Deposition and Comparison with Theoretical Models, Sedimentology, 42, 117–146, https://doi.org/10.1111/j.1365-3091.1995.tb01274.x, 1995. a
Booker, W. H.: Plot data and code, https://doi.org/10.5281/zenodo.3626231, 2020. a
Breiman, L.: Random Forests, Mach. Learn., 45, 5–32, https://doi.org/10.1023/A:1010933404324, 2001. a
Cherkauer, D. S.: Minimization of Power Expenditure in a Riffle-Pool Alluvial Channel, Water Resour. Res., 9, 1613–1628, https://doi.org/10.1029/WR009i006p01613, 1973. a, b
Church, M.: Bed Material Transport and the Morphology of Alluvial River Channels, Annu. Rev. Earth Planet. Sci., 34, 325–354, https://doi.org/10.1146/annurev.earth.33.092203.122721, 2006. a, b, c, d, e, f
Church, M. and Hassan, M. A.: Size and Distance of Travel of Unconstrained Clasts on a Streambed, Water Resour. Res., 28, 299–303, https://doi.org/10.1029/91WR02523, 1992. a
Church, M., Hassan, M. A., and Wolcott, J. F.: Stabilizing Self-Organized Structures in Gravel-Bed Stream Channels: Field and Experimental Observations, Water Resour. Res., 34, 3169–3179, https://doi.org/10.1029/98WR00484, 1998. a, b
Clarke, L., Quine, T. A., and Nicholas, A.: An Experimental Investigation of Autogenic Behaviour during Alluvial Fan Evolution, Geomorphology, 115, 278–285, https://doi.org/10.1016/j.geomorph.2009.06.033, 2010. a
Cudden, J. R. and Hoey, T. B.: The Causes of Bedload Pulses in a Gravel Channel: The Implications of Bedload Grain-Size Distributions, Earth Surf. Proc. Land., 28, 1411–1428, https://doi.org/10.1002/esp.521, 2003. a
Curran, J. and Wilcock, P. R.: Effect of Sand Supply on Transport Rates in a Gravel-Bed Channel, J. Hydraul. Eng., 131, 961–967, 2005. a, b
Delorme, P., Voller, V., Paola, C., Devauchelle, O., Lajeunesse,É., Barrier, L., and Métivier, F.: Self-Similar Growth of a Bimodal Laboratory Fan, Earth Surf. Dynam., 5, 239–252, https://doi.org/10.5194/esurf-5-239-2017, 2017. a
Dietrich, W. E., Kirchner, J. W., Ikeda, H., and Iseya, F.: Sediment Supply and the Development of the Coarse Surface Layer in Gravel-Bedded Rivers, Lett. Nat., 340, 215–217, 1989. a
Dietrich, W. E., Nelson, P. A., Yager, E. M., Venditti, J. G., Lamb, M. P., and Collins, L.: Sediment Patches, Sediment Supply, and Channel Morphology, in: River, Coastal and Estuarine Morphodynamics: RCEM 2005, vol. 1, edited by: Parker, G. and García, M., Taylor & Francis, London, 79–90, https://doi.org/10.1201/9781439833896, 2006. a
Dunkerley, D. L.: The Development of Armour in the Tambo River, Victoria, Australia, Earth Surf. Proc. Land., 15, 405–412, https://doi.org/10.1002/esp.3290150504, 1990. a
Eaton, B. C. and Church, M.: A Graded Stream Response Relation for Bed Load–Dominated Streams, J. Geophys. Res.-Earth, 109, F03011, https://doi.org/10.1029/2003JF000062, 2004. a, b
Eaton, B. C. and Church, M.: A Rational Sediment Transport Scaling Relation Based on Dimensionless Stream Power, Earth Surf. Proc. Land., 36, 901–910, https://doi.org/10.1002/esp.2120, 2011. a, b
Ferguson, R. I.: Understanding Braiding Processes in Gravel-Bed Rivers: Progress and Unsolved Problems, Geol. Soc. Lond. Spec. Publ., 75, 73–87, https://doi.org/10.1144/GSL.SP.1993.075.01.03, 1993. a
Ferguson, R. I.: Flow Resistance Equations for Gravel- and Boulder-Bed Streams, Water Resour. Res., 43, W05427, https://doi.org/10.1029/2006WR005422, 2007. a
Ferguson, R. I., Prestegaard, K. L., and Ashworth, P. J.: Influence of Sand on Hydraulics and Gravel Transport in a Braided Gravel Bed River, Water Resour. Res., 25, 635–643, https://doi.org/10.1029/WR025i004p00635, 1989. a
Field, J.: Channel Avulsion on Alluvial Fans in Southern Arizona, Geomorphology, 37, 93–104, https://doi.org/10.1016/S0169-555X(00)00064-7, 2001. a
Fukuoka, S.: Finite Amplitude Development of Alternate Bars, in: River Meandering, edited by: Ikeda, S. and Parker, G., American Geophysical Union, Washington, D.C., 237–265, https://doi.org/10.1029/WM012p0237, 1989. a
Gilbert, G. K.: Hydraulic-Mining Débris in the Sierra Nevada, US Geological Survey Professional Paper 105, US Government Printing Office, Washington, D.C., 1917. a
Gomez, B.: Effects of Particle Shape and Mobility on Stable Armor Development, Water Resour. Res., 30, 2229–2239, https://doi.org/10.1029/94WR00770, 1994. a
Guerit, L., Métivier, F., Devauchelle, O., Lajeunesse, E., and Barrier, L.: Laboratory Alluvial Fans in One Dimension, Phys. Rev. E, 90, 022203, https://doi.org/10.1103/PhysRevE.90.022203, 2014. a
Harvey, A. M.: The Influence of Sediment Supply on the Channel Morphology of Upland Streams: Howgill Fells, Northwest England, Earth Surf. Proc. Land., 16, 675–684, https://doi.org/10.1002/esp.3290160711, 1991. a
Harvey, A. M.: Coupling between Hillslopes and Channels in Upland Fluvial Systems: Implications for Landscape Sensitivity, Illustrated from the Howgill Fells, Northwest England, Catena, 42, 225–250, https://doi.org/10.1016/S0341-8162(00)00139-9, 2001. a
Haschenburger, J. K. and Wilcock, P. R.: Partial Transport in a Natural Gravel Bed Channel, Water Resour. Res., 39, 1020, https://doi.org/10.1029/2002WR001532, 2003. a
Hassan, M. A., Smith, B. J., Hogan, D. L., Luzi, D. S., Zimmermann, A. E., and Eaton, B. C.: 18 Sediment Storage and Transport in Coarse Bed Streams: Scale Considerations, in: Gravel-Bed Rivers VI: From Process Understanding to River Restoration, vol. 11 of Developments in Earth Surface Processes, edited by: Habersack, H., Piégay, H., and Rinaldi, M., Elsevier, Amsterdam, the Netherlands, 473–496, https://doi.org/10.1016/S0928-2025(07)11137-8, 2007. a
Hey, R.: Bar Form Resistance in Gravel-Bed Rivers, J. Hydraul. Eng., 114, 1498–1508, https://doi.org/10.1061/(ASCE)0733-9429(1988)114:12(1498), 1988. a
Howard, A. D. and Kerby, G.: Channel Changes in Badlands, GSA Bulletin, 94, 739–752, https://doi.org/10.1130/0016-7606(1983)94<739:CCIB>2.0.CO;2, 1983. a
Iseya, F. and Ikeda, H.: Pulsations in Bedload Transport Rates Induced by a Longitudinal Sediment Sorting: A Flume Study Using Sand and Gravel Mixtures, Geograf. Ann. A, 69, 15–27, https://doi.org/10.2307/521363, 1987. a, b, c
Kasai, M., Marutani, T., and Brierley, G.: Channel Bed Adjustments Following Major Aggradation in a Steep Headwater Setting: Findings from Oyabu Creek, Kyushu, Japan, Geomorphology, 62, 199–215, https://doi.org/10.1016/j.geomorph.2004.03.001, 2004. a
Kondolf, G. M.: Hungry Water: Effects of Dams and Gravel Mining on River Channels, Environ. Manage., 21, 533–551, https://doi.org/10.1007/s002679900048, 1997. a
Lane, E. W.: The Importance of Fluvial Morphology in Hydraulic Engineering, P. Am. Soc. Civ. Eng., 81, 1–17, 1955. a, b, c, d
Langbein, W. B. and Leopold, L. B.: River Meanders – Theory of Minimum Variance, USGS Numbered Series 422-H, US Government Printing Office, Washington, D.C., 1966. a
Lanzoni, S.: Experiments on Bar Formation in a Straight Flume: 2. Graded Sediment, Water Resour. Res., 36, 3351–3363, https://doi.org/10.1029/2000WR900161, 2000. a
Laronne, J. B. and Carson, M. A.: Interrelationships between Bed Morphology and Bed-Material Transport for a Small, Gravel-Bed Channel, Sedimentology, 23, 67–85, https://doi.org/10.1111/j.1365-3091.1976.tb00039.x, 1976. a
Lenzi, M. A., Mao, L., and Comiti, F.: When Does Bedload Transport Begin in Steep Boulder-Bed Streams?, Hydrol. Process., 20, 3517–3533, https://doi.org/10.1002/hyp.6168, 2006. a
Leopold, L. B. and Maddock, T.: The Hydraulic Geometry of Stream Channels and Some Physiographic Implications, USGS Numbered Series 252, US Government Printing Office, Washington, D.C., 1953. a
Leopold, L. B. and Wolman, M.: River Channel Patterns: Braided, Meandering, and Straight, US Geological Survey Professional Paper 282-B, US Geological Survey, Washington, D.C., 1957. a, b
Liaw, A. and Wiener, M.: Classification and Regression by random Forest, R News, 2, 18–22, 2002. a
Lisle, T. E.: Overview: Channel Morphology and Sediment Transport in Steepland Streams, in: Erosion and Sedimentation in the Pacific Rim (Proceedings of the Corvallis Symposium, August 1987), edited by: Beschta, R., Blinn, T., Grant, G. E., Swanson, F. J., and Ice, G. G., International Association of Hydrological Sciences Pub. No. 165, Association of Hydrological Sciences, Wallingford, England, 287–297, 1987. a
Lisle, T. E. and Hilton, S.: The Volume of Fine Sediment in Pools: An Index of Sediment Supply in Gravel-Bed Streams1, J. Am. Water Resour. Assoc., 28, 371–383, https://doi.org/10.1111/j.1752-1688.1992.tb04003.x, 1992. a
Lisle, T. E., Ikeda, H., and Iseya, F.: Formation of Stationary Alternate Bars in a Steep Channel with Mixed-Size Sediment: A Flume Experiment, Earth Surf. Proc. Land., 16, 463–469, https://doi.org/10.1002/esp.3290160507, 1991. a, b, c, d, e
MacKenzie, L. G. and Eaton, B. C.: Large Grains Matter: Contrasting Bed Stability and Morphodynamics during Two Nearly Identical Experiments, Earth Surf. Proc. Land., 42, 1287–1295, https://doi.org/10.1002/esp.4122, 2017. a, b, c, d
MacKenzie, L. G., Eaton, B. C., and Church, M.: Breaking from the Average: Why Large Grains Matter in Gravel-Bed Streams, Earth Surf. Proc. Land., 43, 3190–3196, https://doi.org/10.1002/esp.4465, 2018. a
Mackin, J. H.: Concept of the Graded River, Geol. Soc. Am. Bull., 59, 463–512, https://doi.org/10.1130/0016-7606(1948)59[463:COTGR]2.0.CO;2, 1948. a
Madej, M. A.: Sediment Transport and Channel Changes in an Aggrading Stream in the Puget Lowland, Washington, Federal Government Series NW 141, US Forest Service, Washington, D.C., 1982. a
Madej, M. A. and Ozaki, V.: Channel Response to Sediment Wave Propagation and Movement, Redwood Creek, California, Usa, Earth Surf. Proc. Land., 21, 911–927, https://doi.org/10.1002/(SICI)1096-9837(199610)21:10<911::AID-ESP621>3.0.CO;2-1, 1996. a
Masteller, C. C. and Finnegan, N. J.: Interplay between Grain Protrusion and Sediment Entrainment in an Experimental Flume, J. Geophys. Res.-Earth, 122, 274–289, https://doi.org/10.1002/2016JF003943, 2017. a, b
Monsalve, A. and Yager, E. M.: Bed Surface Adjustments to Spatially Variable Flow in Low Relative Submergence Regimes, Water Resour. Res., 53, 9350–9367, https://doi.org/10.1002/2017WR020845, 2017. a
Montgomery, D. R. and Buffington, J. M.: Channel-Reach Morphology in Mountain Drainage Basins, Geol. Soc. Am. Bull., 109, 596–611, https://doi.org/10.1130/0016-7606(1997)109<0596:CRMIMD>2.3.CO;2, 1997. a
Moss, A. J.: The Physical Nature of Common Sandy and Pebbly Deposits; Part II, Am. J. Sci., 261, 297–343, https://doi.org/10.2475/ajs.261.4.297, 1963. a, b
Nelson, P. A., Venditti, J. G., Dietrich, W. E., Kirchner, J. W., Ikeda, H., Iseya, F., and Sklar, L. S.: Response of Bed Surface Patchiness to Reductions in Sediment Supply, J. Geophys. Res.-Earth, 114, F02005, https://doi.org/10.1029/2008JF001144, 2009. a
Nelson, P. A., Dietrich, W. E., and Venditti, J. G.: Bed Topography and the Development of Forced Bed Surface Patches, J. Geophys. Res.-Earth, 115, F04024, https://doi.org/10.1029/2010JF001747, 2010. a
Parker, G.: Surface-Based Bedload Transport Relation for Gravel Rivers, J. Hydraul. Res., 28, 417–436, https://doi.org/10.1080/00221689009499058, 1990. a, b
Parker, G. and Klingeman, P. C.: On Why Gravel Bed Streams Are Paved, Water Resour. Res., 18, 1409–1423, https://doi.org/10.1029/WR018i005p01409, 1982. a, b
Parker, G. and Sutherland, A. J.: Fluvial Armor, J. Hydraul. Re., 28, 529–544, https://doi.org/10.1080/00221689009499044, 1990. a, b
Parker, G., Dhamotharan, S., and Stefan, H.: Model Experiments on Mobile, Paved Gravel Bed Streams, Water Resour. Res., 18, 1395–1408, https://doi.org/10.1029/WR018i005p01395, 1982a. a
Parker, G., Klingeman, P. C., and McLean, D. G.: Bedload and size distribution in paved gravel-bed streams, J. Hydraul. Div.-ASCE, 108, 544–571, 1982b. a
Peakall, J., Ashworth, P., and Best, J.: Physical Modelling in Fluvial Geomorphology: Principles, Applications and Unresolved Issues, in: The Scientific Nature of Geomorphology, edited by: Rhoads, B. L. and Thorn, C., John Wiley & Sons, Ltd, Chichester, 221–253, 1996. a
Prancevic, J. P. and Lamb, M. P.: Unraveling Bed Slope from Relative Roughness in Initial Sediment Motion, J. Geophys. Res.-Earth, 120, 474–489, https://doi.org/10.1002/2014JF003323, 2015. a
Pryor, B. S., Lisle, T., Montoya, D. S., and Hilton, S.: Transport and Storage of Bed Material in a Gravel-Bed Channel during Episodes of Aggradation and Degradation: A Field and Flume Study, Earth Surf. Proc. Land., 36, 2028–2041, https://doi.org/10.1002/esp.2224, 2011. a
Pyrce, R. S. and Ashmore, P. E.: Particle Path Length Distributions in Meandering Gravel-Bed Streams: Results from Physical Models, Earth Surf. Proc. Land., 28, 951–966, https://doi.org/10.1002/esp.498, 2003a. a
Pyrce, R. S. and Ashmore, P. E.: The Relation between Particle Path Length Distributions and Channel Morphology in Gravel-Bed Streams: A Synthesis, Geomorphology, 56, 167–187, https://doi.org/10.1016/S0169-555X(03)00077-1, 2003b. a
Pyrce, R. S. and Ashmore, P. E.: Bedload Path Length and Point Bar Development in Gravel-Bed River Models, Sedimentology, 52, 839–857, https://doi.org/10.1111/j.1365-3091.2005.00714.x, 2005. a, b
Recking, A.: A Comparison between Flume and Field Bed Load Transport Data and Consequences for Surface-Based Bed Load Transport Prediction, Water Resour. Res., 46, W03518, https://doi.org/10.1029/2009WR008007, 2010. a
Recking, A.: Simple Method for Calculating Reach-Averaged Bed-Load Transport, J. Hydraul. Eng., 139, 70–75, https://doi.org/10.1061/(ASCE)HY.1943-7900.0000653, 2013. a, b, c
Recking, A., Frey, P., Paquier, A., Belleudy, P., and Champagne, J. Y.: Feedback between Bed Load Transport and Flow Resistance in Gravel and Cobble Bed Rivers, Water Resour. Res., 44, W05412, https://doi.org/10.1029/2007WR006219, 2008. a
Recking, A., Frey, P., Paquier, A., and Belleudy, P.: An Experimental Investigation of Mechanisms Involved in Bed Load Sheet Production and Migration, J. Geophys. Res., 114, F03010, https://doi.org/10.1029/2008JF000990, 2009. a
Reitz, M. D. and Jerolmack, D. J.: Experimental Alluvial Fan Evolution: Channel Dynamics, Slope Controls, and Shoreline Growth, J. Geophys. Res.-Earth, 117, F02021, https://doi.org/10.1029/2011JF002261, 2012. a
Schmeeckle, M. W., Nelson, J. M., and Shreve, R. L.: Forces on Stationary Particles in Near-Bed Turbulent Flows, J. Geophys. Res.-Earth, 112, F02003, https://doi.org/10.1029/2006JF000536, 2007. a
Schumm, S. A., Mosley, M. P., and Weaver, W.: Experimental Fluvial Geomorphology, John Wiley & Sons, New York, p. 413, 1987. a
Sutherland, A. J.: Static Armour Layers by Selective Erosion, in: Sediment Transport in Gravel-Bed Rivers, edited by: Thorne, C. R., Bathurst, J., and Hey, R., John Wiley & Sons, Ltd, Chichester, 1987. a, b
Venditti, J. G., Nelson, P. A., Bradley, R. W., Haught, D., and Gitto, A. B.: Bedforms, Structures, Patches and Sediment Supply in Gravel-Bed Rivers, in: Gravel-Bed Rivers: Processes and Disasters, edited by: Tsutsumi, D. and Laronne, J. B., John Wiley & Sons, Chichester, England, 439–466, 2017. a
Vericat, D., Batalla, R. J., and Garcia, C.: Breakup and Reestablishment of the Armour Layer in a Large Gravel-Bed River below Dams: The Lower Ebro, Geomorphology, 76, 122–136, https://doi.org/10.1016/j.geomorph.2005.10.005, 2006. a
Warburton, J.: Observations of Bed Load Transport and Channel Bed Changes in a Proglacial Mountain Stream, Arct. Alp. Res., 24, 195–203, https://doi.org/10.2307/1551657, 1992. a, b
Wilcock, P. R.: Critical Shear Stress of Natural Sediments, J. Hydraul. Eng., 119, 491–505, 1993. a
Wilcock, P. R. and Crowe, J. C.: Surface-Based Transport Model for Mixed-Size Sediment, J. Hydraul. Eng., 129, 120–128, https://doi.org/10.1061/(ASCE)0733-9429(2003)129:2(120), 2003. a, b, c
Wilcock, P. R. and McArdell, B. W.: Surface-Based Fractional Transport Rates: Mobilization Thresholds and Partial Transport of a Sand-Gravel Sediment, Water Resour. Res., 29, 1297–1312, https://doi.org/10.1029/92WR02748, 1993. a
Wilcock, P. R., Kenworthy, S. T., and Crowe, J. C.: Experimental Study of the Transport of Mixed Sand and Gravel, Water Resour. Res., 37, 3349–3358, https://doi.org/10.1029/2001WR000683, 2001. a
Zimmermann, A., Church, M., and Hassan, M. A.: Step-Pool Stability: Testing the Jammed State Hypothesis, J. Geophys. Res.-Earth, 115, F02008, https://doi.org/10.1029/2009JF001365, 2010. a