the Creative Commons Attribution 4.0 License.
the Creative Commons Attribution 4.0 License.
 | 21 Oct 2020
Experimental study of sediment supply control on step formation, evolution, and stability
Marwan A. Hassan
We present results from an experimental campaign conducted in a steep flume subject to longitudinal width variations and different sediment feed rates. The experiments were designed to study how sediment supply influences step formation, step location, and step stability. Our results show that steps are more likely to form in segments of the channel where the width narrows because of particle jamming, and these steps are also more stable. Sediment feed increases particle activity which generates a dynamic channel morphology with steps forming and collapsing. A comparison with experiments without sediment feed shows that sediment supply does not inhibit step formation. Time series of step formation, evolution, and destruction show that the maximum number of steps is achieved when the sediment feed is larger than zero but smaller than the transport capacity. We summarize this outcome in a conceptual model where the dependence of step frequency on sediment supply is expressed by a bell curve. Sediment yield measured at the channel outlet followed the sediment feed at the inlet closely, even when we fed 50 % more and 50 % less than the calculated transport capacity. This outcome challenges the applicability of the concept of transport capacity to steep channels and highlights the key role played by sediment feed in dictating sediment yield and channel response. Finally, we detected a positive correlation between sediment concentration and step destruction, which stresses the importance of particle interactions for step formation and stability.
- Article
(3907 KB) - Full-text XML
- BibTeX
- EndNote


Step-pool channels are often found in steep mountain streams, where large boulders and woody debris jam in the transverse direction, forming steps followed by pools of finer sediment (Chartrand et al., 2011; Grant et al., 1990; Montgomery and Buffington, 1997). This morphology has been extensively studied because it appeals visually, provides good habitats for fish, and is an effective tool for energy dissipation that keeps the channel stable even at high flows (see reviews by Chin and Wohl, 2005; Church and Zimmermann, 2007; Comiti and Mao, 2012). For these reasons, step-pool channels are often artificially designed in stream restoration projects (e.g., Comiti et al., 2009b; Yu et al., 2010), instead of infrastructures made of concrete, such as check dams (Chin et al., 2009; Piton et al., 2017). Therefore, geomorphologists and engineers require understanding of the conditions under which steps form, remain stable, and destabilize.
Several studies in the last decades have increased our knowledge on how step-pool systems function, especially with regard to the step-forming mechanisms (Chin, 1999; Curran, 2007; Golly et al., 2019; Saletti et al., 2016; Zimmermann et al., 2010), the stability of steps (Waters and Curran, 2012; Zhang et al., 2019, 2018; Zimmermann et al., 2010), the links between channel and hillslope dynamics (Golly et al., 2017; Molnar et al., 2010), and the relations between flow magnitude, flow resistance, and sediment transport (Comiti et al., 2009a; Hohermuth and Weitbrecht, 2018; Saletti et al., 2015; Turowski et al., 2009; Zimmermann, 2010). Field studies and flume experiments highlighted how boulder protrusion (Yager et al., 2018, 2007), grain clustering (Johnson, 2017), and the supply of fine sediment (Johnson et al., 2015) impact flow resistance and therefore channel stability and sediment transport in step-pool channels. Furthermore, the importance of granular interactions for step formation and stability has been previously recognized (Church and Zimmermann, 2007; Saletti et al., 2016) and it has been suggested that steps are more stable than predicted because of the emergence of force chains in the transversal direction that keep them in place even when subjected to higher shear stress (Bouchard et al., 2001; Church and Zimmermann, 2007; Saletti and Hassan, 2020a). The basic questions of how and where steps form and under which conditions remain stable is paramount for practitioners who are often asked to design steps (or similar structures) to stabilize steep channels while maintaining their ecological value and visual appeal (e.g., Chin et al., 2009; Thomas et al., 2000). Existing design criteria consider only flow variables (e.g., flow rate and flow depth), grain size, and channel geometry, ignoring factors that might strongly impact the stability of artificial step pools (e.g., sediment supply and longitudinal width variations).
More recently, Golly et al. (2019) and Saletti and Hassan (2020a) showed how longitudinal variations in channel width regulate both the process leading to step formation and the locations where steps preferentially form. More specifically, the experiments of Saletti and Hassan (2020a) demonstrated that steps formed by particle jamming in narrow and especially narrowing locations tend to be more frequent and more stable. A limitation of these experiments is that they were conducted in absence of sediment feed, a condition that is not always realistic in mountain streams, especially in those coupled with active hillslopes (e.g., Recking et al., 2012; Turowski et al., 2009) or linked to a source of sediment such as a melting glacier (e.g., Comiti et al., 2019). Sediment supply has been shown to be a very important control on the development and evolution of bedforms in gravel-bed streams (e.g., Hassan et al., 2020; Hassan and Church, 2000; Venditti et al., 2017), but no direct study has addressed the impact of different sediment feed rates on step formation and evolution in a steep channel subject to longitudinal width variations.
To address this issue, we ran experiments with the same flume geometry, same flume discharges, and sediment mixture as used by Saletti and Hassan (2020a) but we fed sediment at different rates, in order to study how steps develop and evolve under different sediment supply regimes. At the end of each experimental run, we turned off the sediment supply and increased the flow rate until the bed was completely scoured to assess channel stability in sediment-starved conditions. Field evidence (Recking et al., 2012) shows that step-pool channels directly connected to sediment sources are less stable, and previous research (e.g., Chin, 1998; Curran, 2007; Saletti et al., 2016; Zimmermann et al., 2010) suggested that low sediment supply is necessary for step stability, because a high sediment supply would bury the steps. More recently, Waters and Curran (2012) conducted experiments with different sediment and water discharges finding a complex relationship between sediment supply, flow resistance, and step stability. In one of the most cited conceptual models for step stability, the jammed-state hypothesis proposed by Church and Zimmermann (2007), one of the three parameters that control step stability is the sediment concentration, defined by the authors as the ratio between sediment supply and water discharge (i.e., ). They hypothesized that the sediment concentration needs to be small in order to achieve step stability, since a large sediment concentration would bury the steps. Our experiments, conducted keeping all conditions the same except for the feed rate, can be used to test this specific hypothesis. We expect that large sediment concentration would also increase particle activity, which is the degree of interaction between the different particles in motion and between these particles and the bed. A large particle activity could possibly enhance both step formation due to granular interactions and step instability due to grain dislodgment.
We frame our study in terms of three main research hypotheses. (1) With sediment feed, narrowing locations should generate more steps because of particle jamming enhanced by a larger particle activity (Golly et al., 2019; Saletti and Hassan, 2020a). (2) An increasing sediment feed rate should cause more sediment transport and a more dynamic channel, therefore leading to increasing chances of step collapse. (3) The relation between step frequency and sediment feed should be described by a curve qualitatively similar to that shown in Fig. 1, where step frequency should be small when sediment supply is too low (as there is an absence of enough particles to form steps) or too high (as there is too much particle activity leading to step collapse and burial), while reaching a maximum for intermediate values of sediment supply.
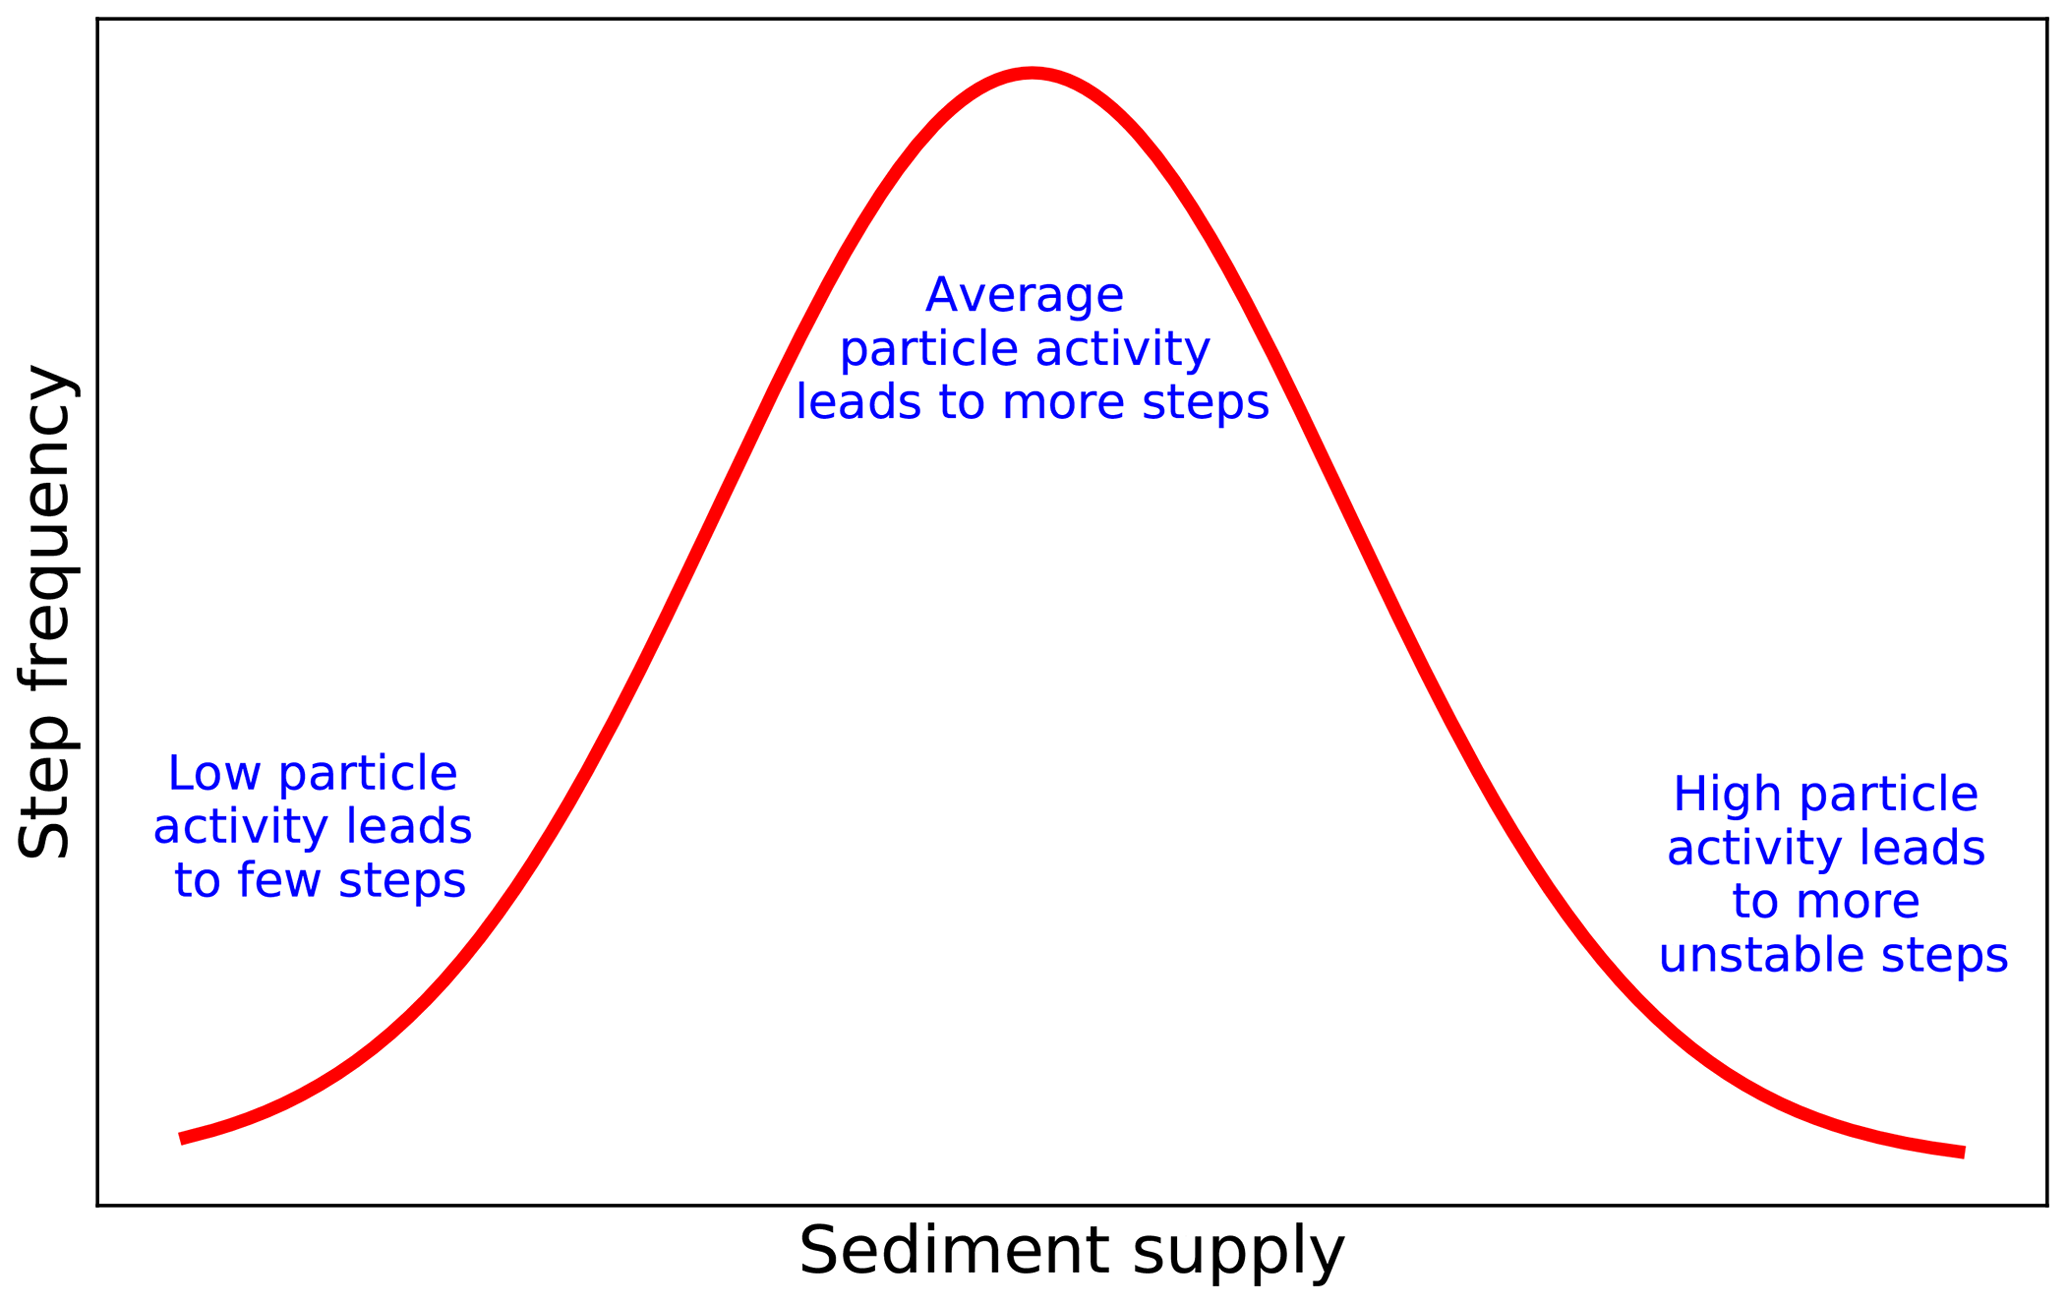
Figure 1Conceptual model that shows step frequency as a function of sediment supply (i.e., particle activity).
The specific research questions we aim to answer are as follows. (1) Does sediment feed rate influence the frequency and location of steps in steep streams? (2) Does the stability of steps (i.e., their survival time) depend on the sediment feed rate and the step location? (3) How do the outcomes of no-feed experiments compare to those of feed experiments in terms of step frequency, location and dynamics? Given the increasing changes in sediment supply regimes due to urbanization and climate change and the widespread use of step-pool channels in stream restoration projects, we believe this is a timely and important topic for both river scientists and practitioners.
We performed three experiments (Exp 50, Exp 100, and Exp 150) in the Mountain Channel Hydraulic Experimental Laboratory at the University of British Columbia, using the same flume geometry and sediment grain-size distribution as in Saletti and Hassan (2020a). We used a 5 m long, 0.5 m wide, and 1 m deep flume at a slope of 8 %. We included trapezoidal concrete elements (Fig. 2a) to create narrow and wide segments (of 20 and 40 cm, respectively), in addition to narrowing and widening segments (Fig. 2b).
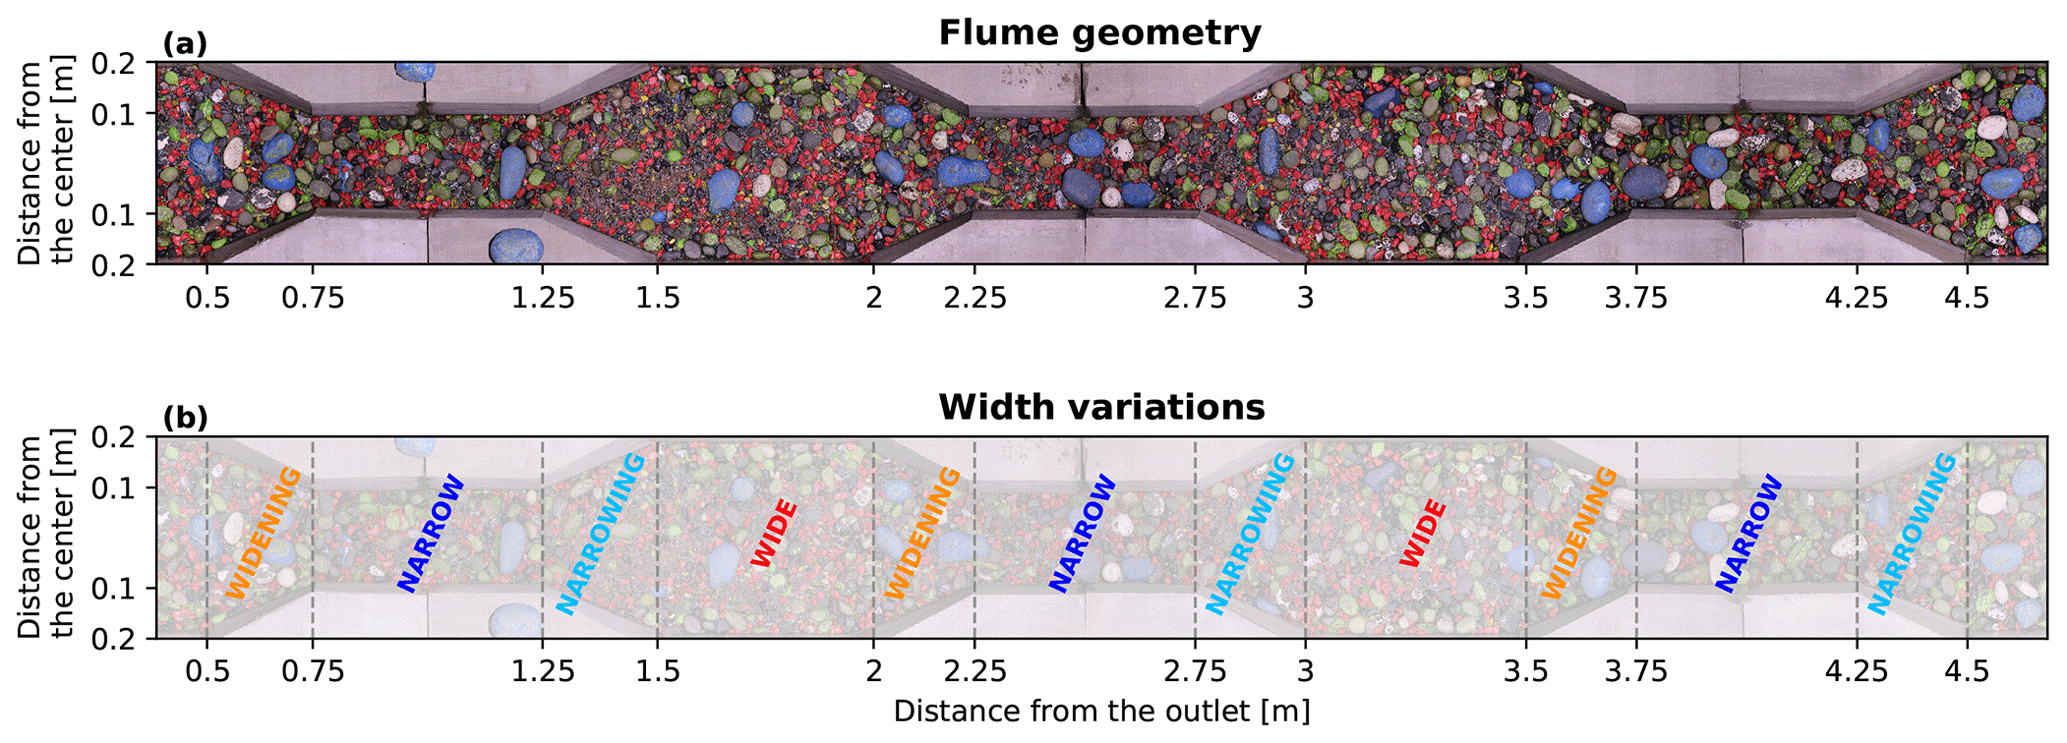
Figure 2(a) Top view of the flume geometry used in the experiments. Grains of different sizes were painted in different colors to facilitate grain-size recognition and surface structure detection. (b) Channel segments of longitudinal width variations. The flow is from right to left.
Before starting each experiment, the flume was filled with a 15 cm deep layer of sediment whose bulk grain-size distribution was the same used by Saletti and Hassan (2020a), having d50=15 mm, d16=3 mm, and d84=29 mm. The mixture included sediment sized between 0.5 and 64 mm, which was divided into 14 ψ∕2 classes (where ψ is defined with respect to the grain size d as d=2ψ). Each class of stone was painted in a different color to facilitate surface grain-size analyses.
After 1 h of conditioning flow (q=5 ) which produced little or no sediment transport, the three experiments were subjected to the same step-wise increasing flow rates (increased by 20 % each hour as done by Saletti and Hassan, 2020a) but different sediment feed rates. We estimated the sediment feed rates using the Wilcock and Crowe (2003) sediment transport model for the bulk grain-size distribution and the different flow rates. These values constituted the feed rates for Experiment 100 (as to 100 % of the transport capacity); the feed rates for Experiments 50 and 150 were obtained by multiplying the feed rates of Experiment 100 by 0.5 and 1.5, respectively. The three experiments represent three different sediment supply regimes, rather than simulate precise values of transport capacity. During each hour, sediment was fed over the first 40 min with a conveyor belt located at the flume inlet; the grain-size distribution of the sediment feed was the same as the bulk one used for the bed. After 7 h, we turned off the supply of sediment and increased the flow rate by 20 % each hour until the bed was scoured, which we define as exposing the bottom of the flume in at least one location. The increase in flow rate was applied every 2 h if during the first hour no major changes in bed stability were observed. We refer to the feed phases in the three experiments as 50F, 100F, and 150F, while we refer to the subsequent no-feed phases as 50N, 100N, and 150N. Table 1 and Fig. 3 report the flow and sediment feed rates used in the three experiments. The starting value of flow rate is larger than that used in Saletti and Hassan (2020a) because the three lowest flow rates used there did not produce significant changes.
Table 1Values of unit discharge q and sediment feed rate Qs used in the experiments.
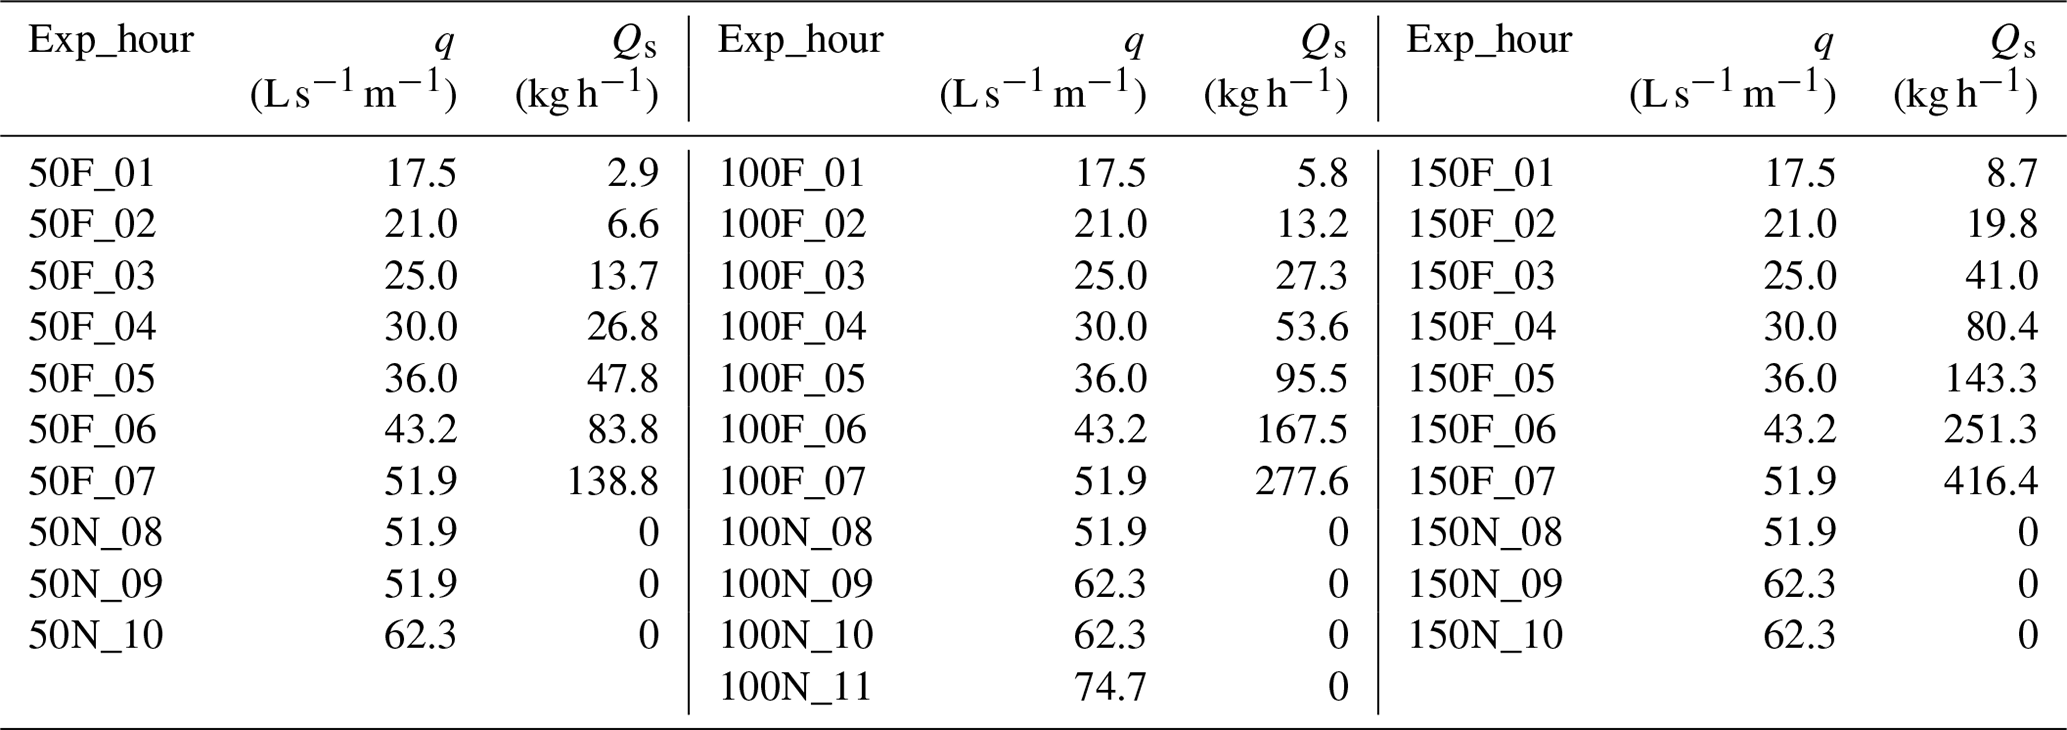
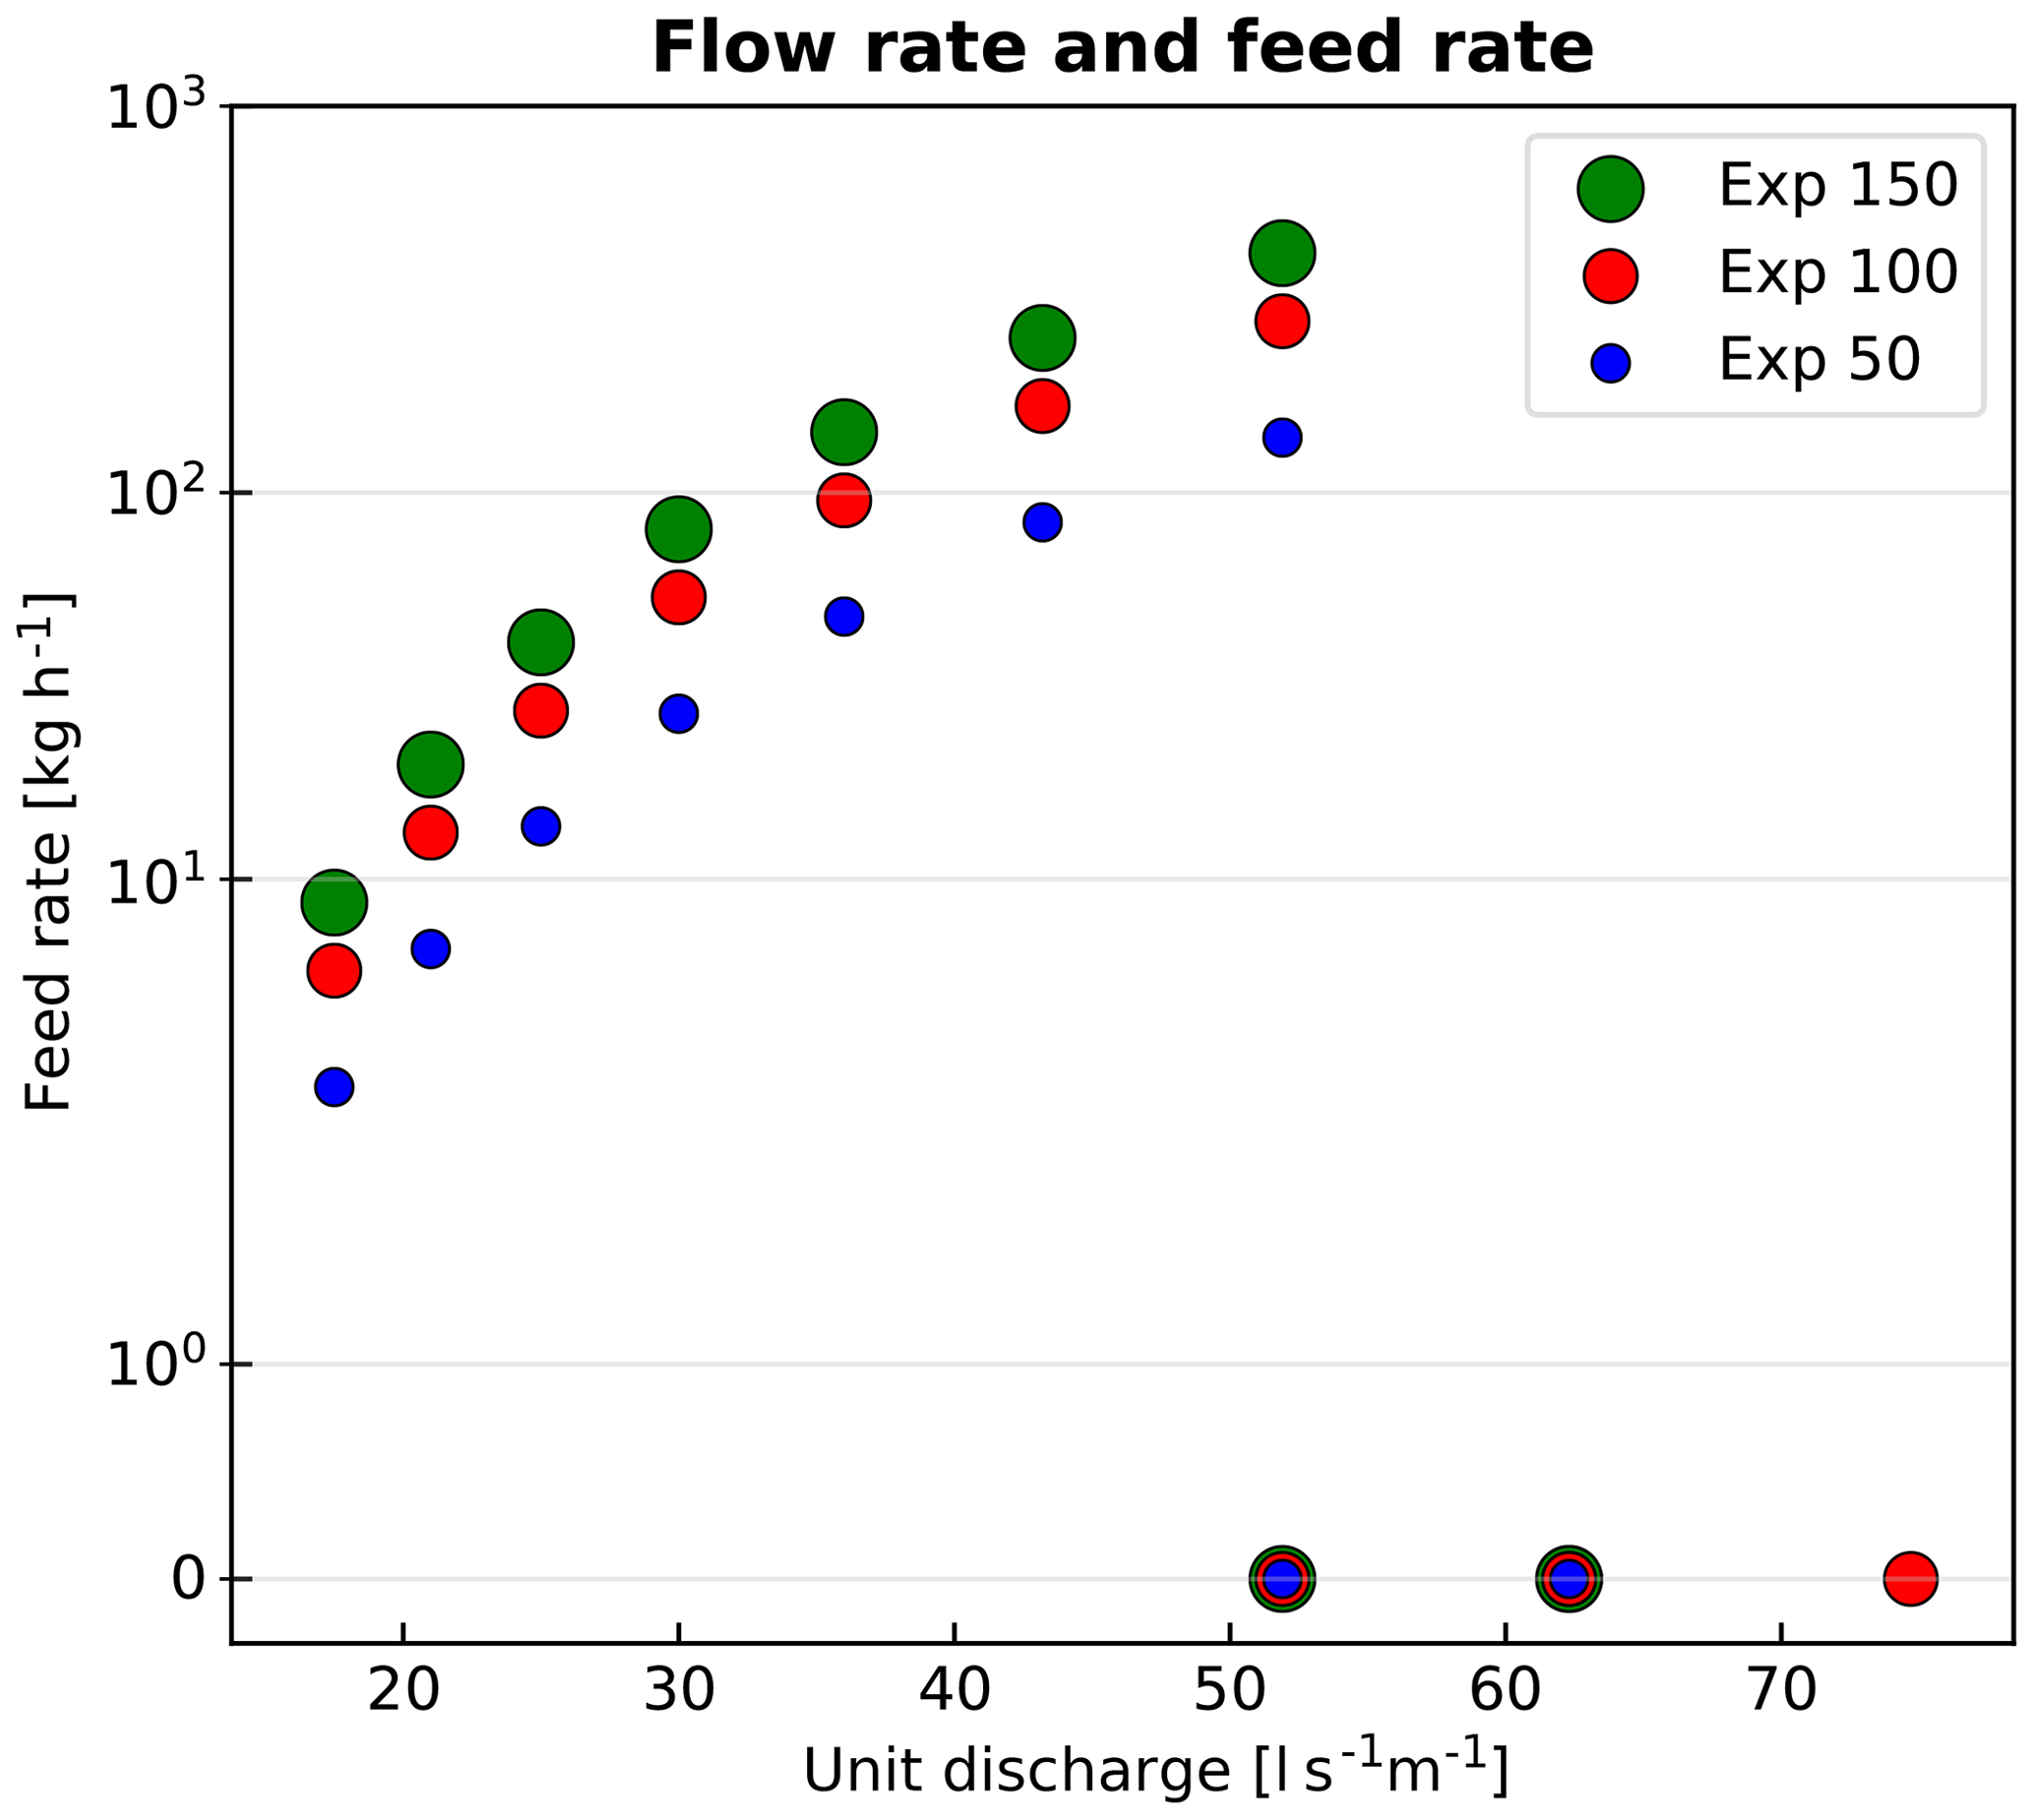
Figure 3Flow rates and feed rates used in the three experiments. The marker size is proportional to the feed rate. After 7 h, in each experiment (see Table 1), we increased the flow rate without feeding sediment.
The flow was stopped every hour to collect topographic and grain-size data using a green laser and a camera mounted on the top of a moving cart. Digital elevation models of the bed surface were obtained from the laser at 2 mm resolution in the horizontal direction and 1 mm resolution in the vertical direction. Photos were used to estimate bed grain-size distribution and identify keystone location as explained in Saletti and Hassan (2020a). A uniformly spaced grid of 200 points was overlapped to the picture and grains at each node were manually identified. Sediment transport rates were measured at the flume outlet at 1 Hz resolution for the 14 grain-size fractions with a light table (Zimmermann et al., 2008a).
Steps were extracted from digital elevation models using a scale-free rule-based algorithm (Saletti and Hassan, 2020a; Zimmermann et al., 2008b) that accounts for spatial variability of step structures. Only steps that occupied more than half of the total channel width were mapped.
The experiments conducted with sediment feed produced more steps than those without it (Saletti and Hassan, 2020a) but higher feed rates decreased the average number of steps. Step formation/collapse and local scour/deposition continually occurred. Narrowing segments formed steps preferentially, as large particles often deposited and jammed. Sediment feed enhanced particle activity for all grain sizes, increasing the frequency of particle–particle and particle–bed interactions, raising the propensity for jamming. Even Experiment 150, where we fed 50 % more of the evaluated transport capacity, did not show significant sediment aggradation. Light-table measurements of sediment transport rates demonstrated that sediment yield matched sediment feed quite closely. Despite large particle activity, localized areas of scour/deposition, and bed surface structure break-up/formation, sediment transport demonstrated steady-state characteristics, with sediment feed and yield differing by at most 10 %. Sediment concentration cs clearly played a role in terms of steps' stability, as more steps collapsed with increasing values of cs.
In the following sections, we present results from Experiments 50, 100, and 150 (hereafter referred to as “feed experiments”) and from the experiments reported in Saletti and Hassan (2020a) (hereafter referred to as “no-feed experiments”) in terms of (a) step frequency, (b) step location, (c) step dynamics, (d) grain-size and sediment yield, and (e) sediment concentration and step stability.
3.1 Step frequency
The steps were identified and tracked from digital elevation models and images in the experiments with the algorithm described in Saletti and Hassan (2020a). All the feed experiments generated a step-pool morphology with the number of steps depending on both flow and feed rates. Experiment 50 had an average number of 9.4 steps per hour (10.3 during the feed part and 7.3 during the no-feed part), Experiment 100 had an average number of 8 steps per hour (9.1 during the feed part and 6 during the no-feed part), and Experiment 150 had an average number of 6.4 steps per hour (7.6 during the feed part and 3.7 during the no feed part). As a comparison, the no-feed experiments (i.e., experiments N3a and N3b in Saletti and Hassan, 2020a) had an average number of 5.4 steps. The relationship between the number of steps and flow rate for the feed experiments is shown in Fig. 4, together with the no-feed experiments.

Figure 4Number of steps detected at the end of each 1 h run in the feed experiments, shown with circles, and in the no-feed experiments from Saletti and Hassan (2020a), shown with squares. The size of the circles is proportional to the sediment feed rate. Dashed lines are the best-fit lines for the experiments; the values of R2 are 0.36, 0.60, and 0.91 for Experiments 50, 100, and 150, respectively. The best-fit line for the no-feed experiments is almost flat but with R2<0.1.
Two main points can be made. (1) There is a large variability in the step count that ranges between 3 and 14 in the feed experiments, and between 3 and 8 in the no-feed experiments. This suggests a very dynamic channel morphology, a point that will be explored in the next sections. (2) The number of steps in the feed experiments decreases with both flow rate (i.e., moving from left to right on the x axis in Fig. 4) and feed rate (i.e., moving from top to bottom in the three different colors in Fig. 4). This decreasing trend becomes stronger as the feed rate increases, as suggested by the R2 values. On the other hand, in the no-feed experiments, there is no clear trend between the number of steps and the flow rate.
3.2 Step location
The no-feed experiments of Saletti and Hassan (2020a) showed that steps are more likely to form in narrow and narrowing segments rather than in wide and widening segments. The feed experiments reported here show a very similar result (Fig. 5). Steps in narrow and narrowing segments (Fig. 5a, b) are generally more common than steps in wide and widening segments (Fig. 5c, d). The number of steps formed in narrowing segments (Fig. 5b) remains high and larger than zero throughout all the experiments, while steps in other segments display a decreasing trend with time and flow rate (Fig. 5a, c, d). As it was observed in the no-feed experiments, the number of steps in narrow segments (Fig. 5a) is quite high at the beginning for low values of flow rate but then it decreases as narrow segments (whose unit discharge is 2 times larger than that in wide segments) are subject to more erosion.
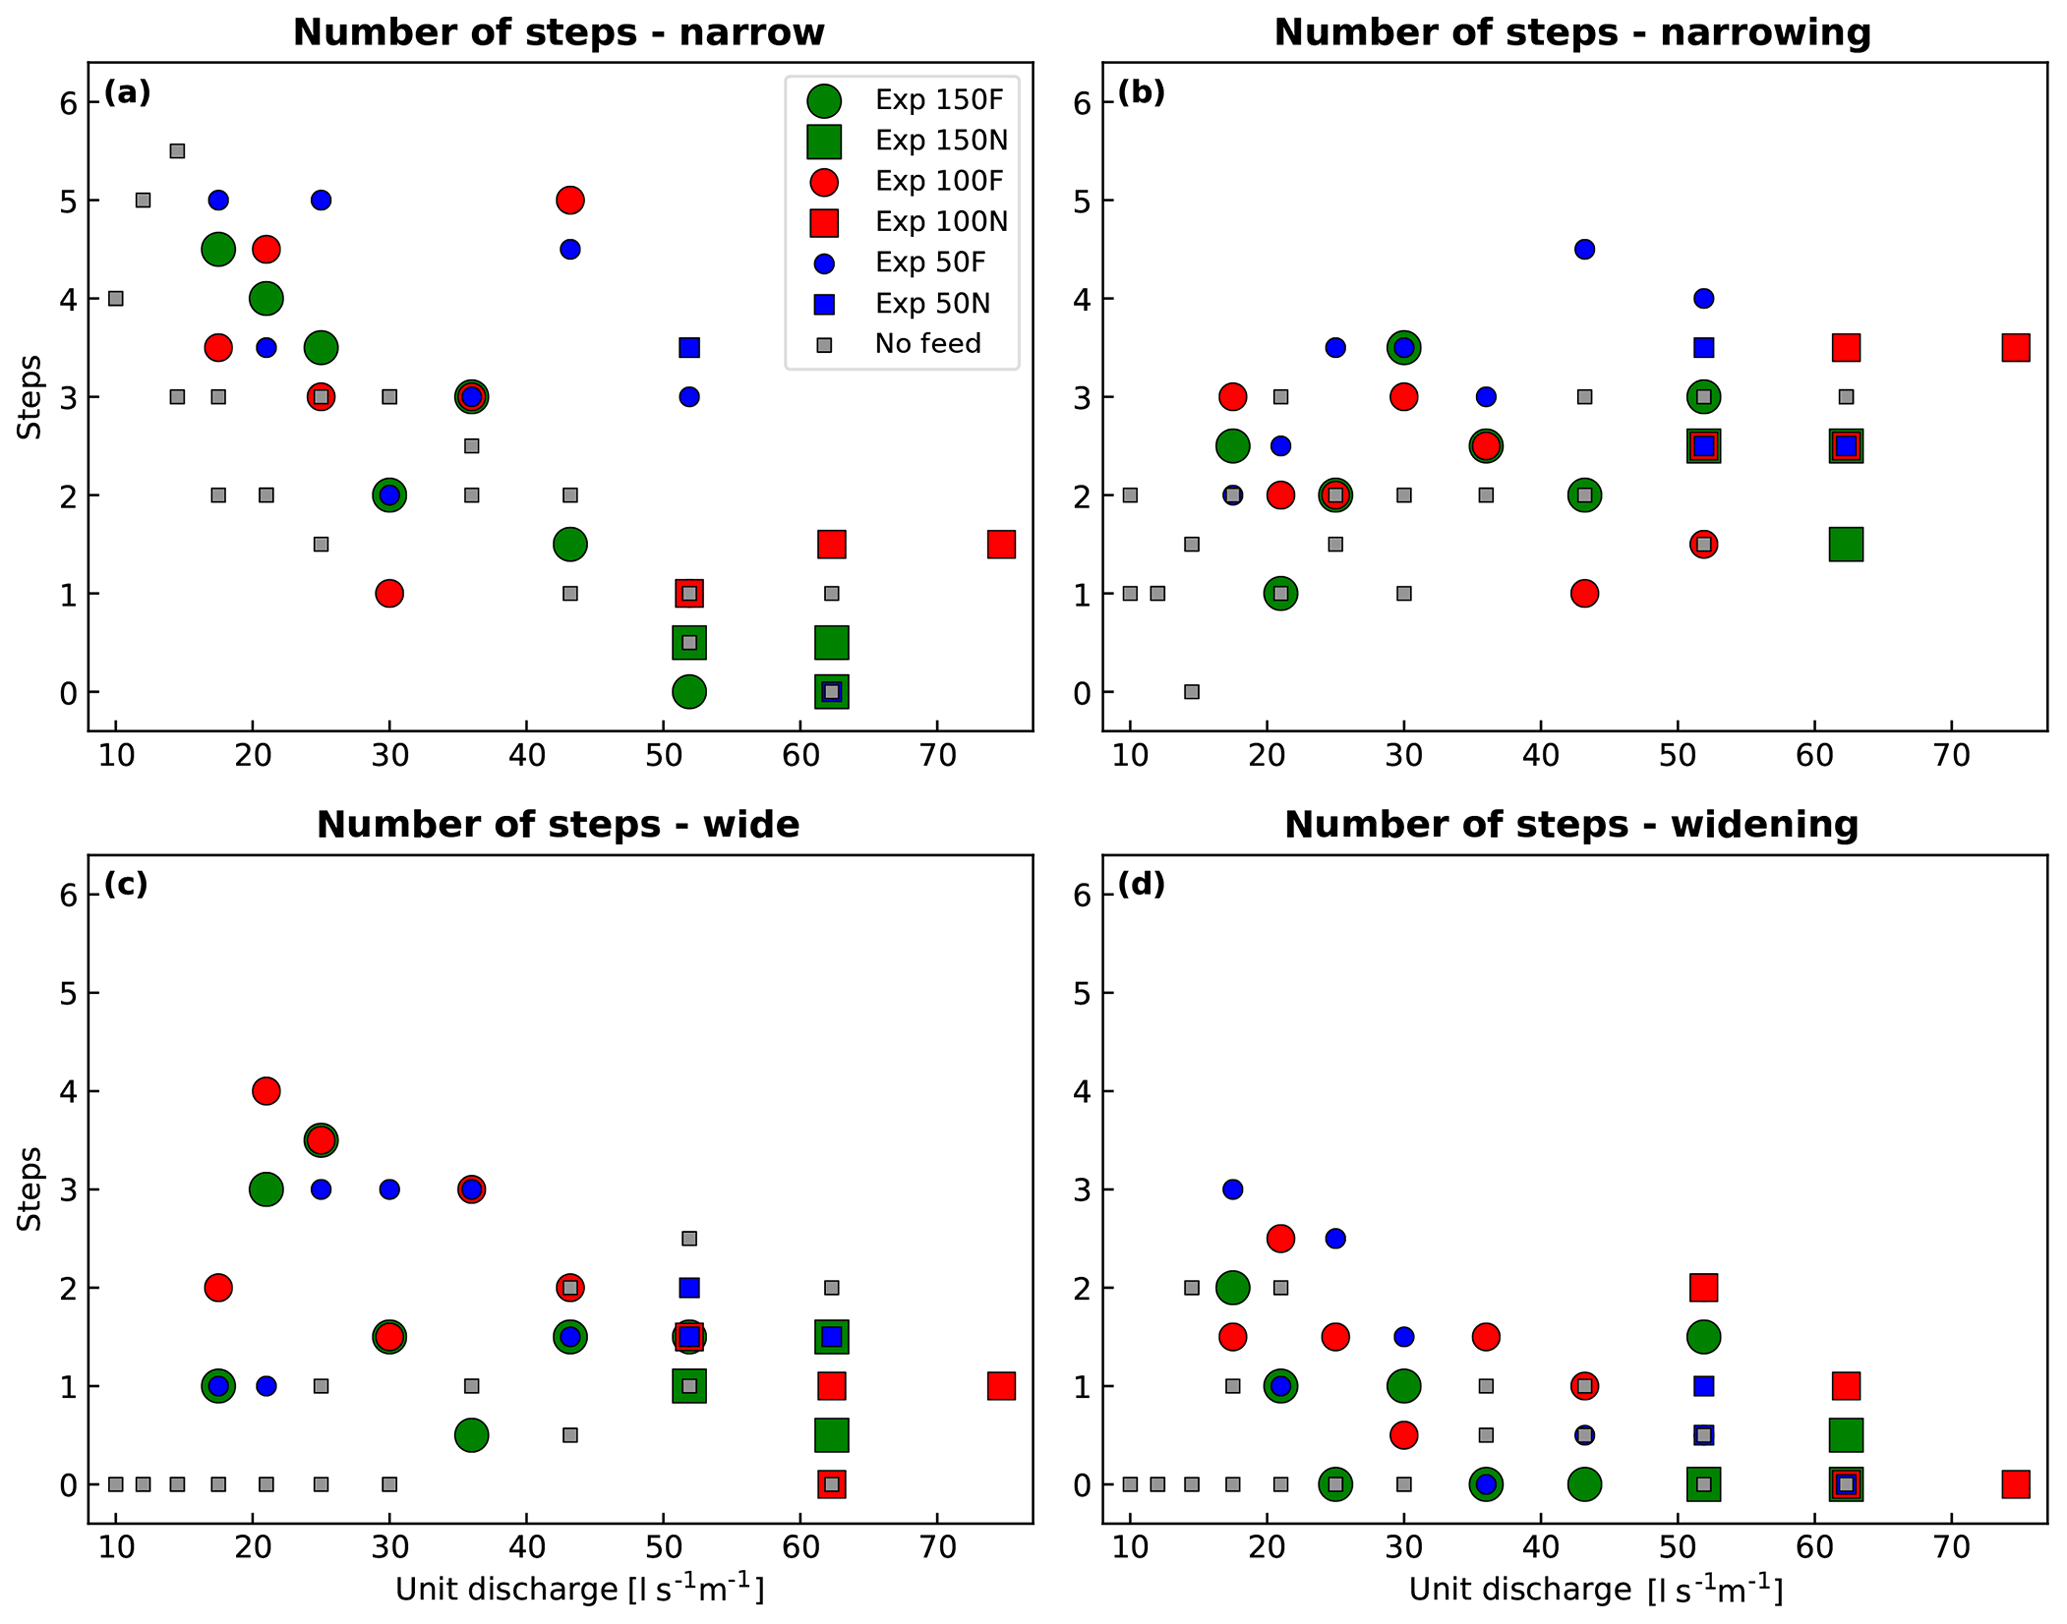
Figure 5Number of steps detected in the feed and in the no-feed experiments at the end of each hour in (a) narrow segments, (b) narrowing segments, (c) wide segments, and (d) widening segments. Portions of experiments with sediment feed are shown with circles, while portions without sediment feed are shown with squares.
The likelihood of steps forming in certain segments can be explored by comparing the fraction of steps in a certain segment (i.e., step fraction) with the fraction of channel length occupied by those segments (i.e., area fraction), as done in Saletti and Hassan (2020a). Step fractions differing significantly from area fractions indicate that width variations matter and that certain segments are more likely than others to have steps. More specifically, step fractions significantly larger than area fractions indicate a high likelihood to find steps in that segment, while step fractions significantly smaller than area fractions indicate a low likelihood to find steps in that segment.
Width variations control step location, with narrowing segments being the predominant place where steps form and remain stable (Fig. 6). The comparison between step fractions and area fractions yields three main results. (1) Narrowing segments are much more likely than others to have steps, and this effect becomes more pronounced as flow rates increase (Fig. 6b). (2) Steps in narrow segments are more common for low to moderate flow rates, but this effect vanishes as flow rates increase and sediment feed is turned off (Fig. 6a). (3) Steps are less likely to form in wide and widening segments (Fig. 6c, d).
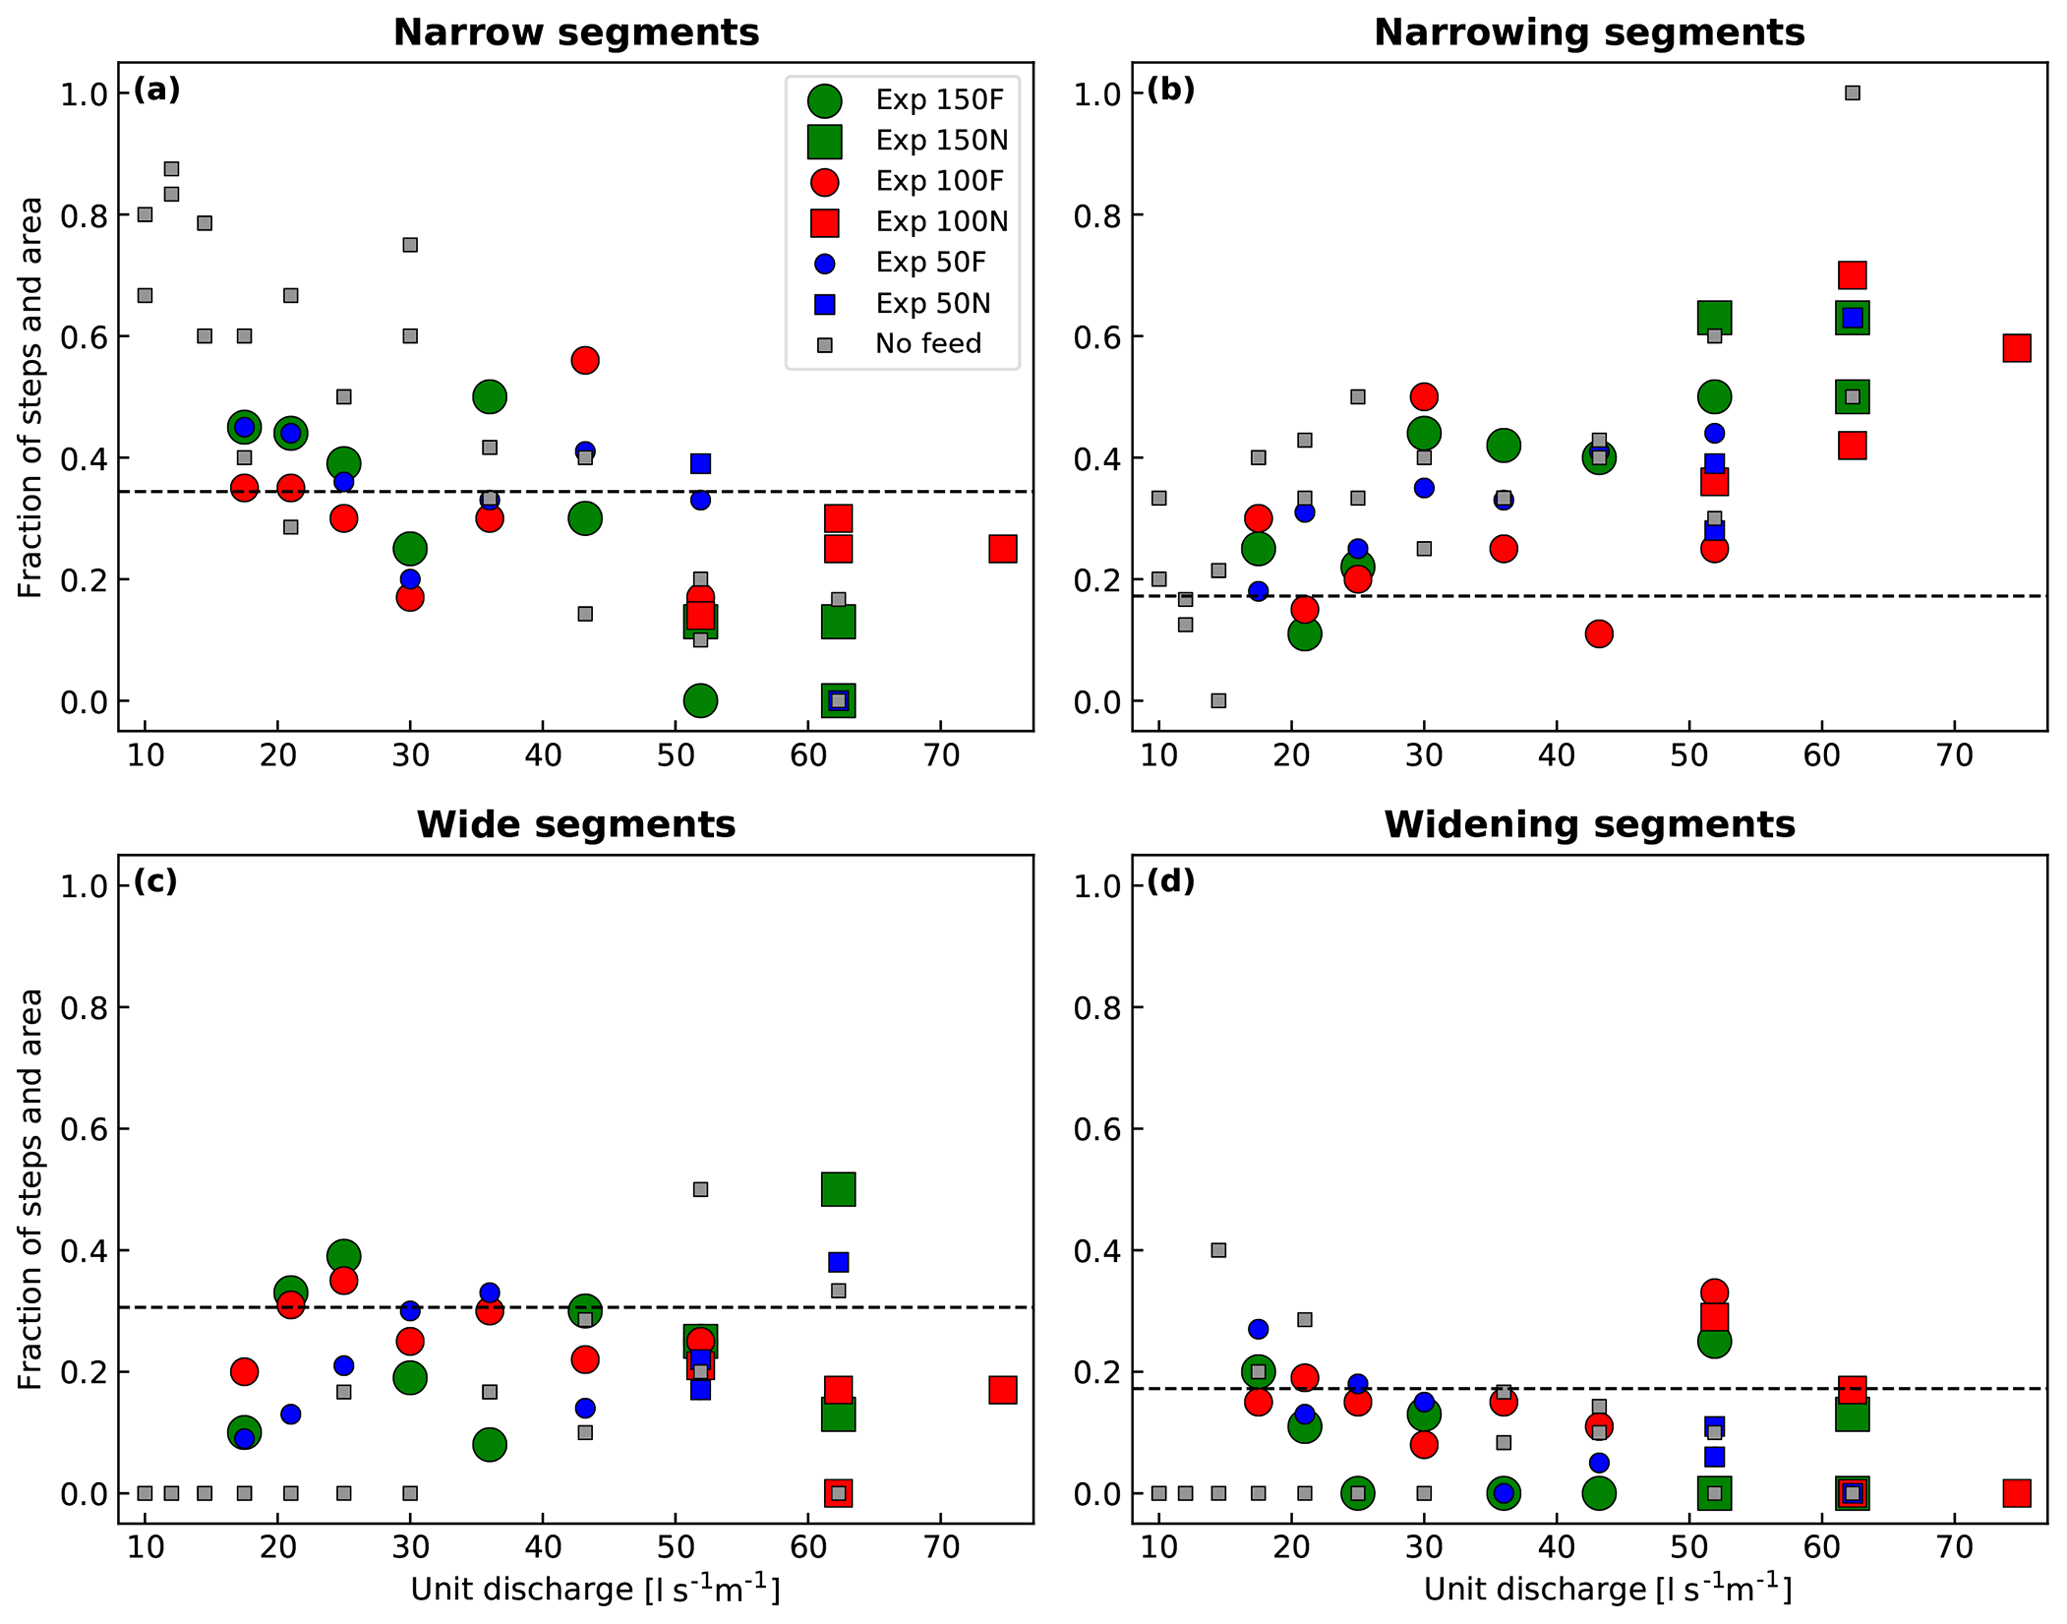
Figure 6Fraction of steps in the feed and no-feed experiments at the end of each hour in (a) narrow segments, (b) narrowing segments, (c) wide segments, and (d) widening segments. Portions of experiments with sediment feed are shown with circles, while portions without sediment feed are shown with squares. The area fraction is shown with a dashed black line for comparison. Markers plotting above the dashed line indicate steps are more likely to occur in these segments; markers plotting below that line indicate instead that steps are less likely to occur in these segments.
These observed trends can be connected to the step-forming mechanisms due to a competition of granular and fluid forces (Saletti and Hassan, 2020a). Narrow and narrowing segments are characterized by a larger bed shear stress but also a lower jamming ratio (i.e., the ratio between channel width and size of the step-forming keystones), and steps there tend to form because of particle jamming. In wide and widening segments, the shear stress is lower but the jamming ratio is higher, and steps there tend to form due to particle deposition around keystones (see Golly et al., 2019). The results of the feed experiments suggest that jamming steps are more frequent than depositional steps. This reinforces the idea that granular interactions are a key process to explain the occurrence and location of steps in steep channels, as previously suggested (e.g., Church and Zimmermann, 2007; Saletti et al., 2016; Saletti and Hassan, 2020a; Zimmermann et al., 2010).
3.3 Step dynamics
We tracked individual steps and their evolution throughout the experiments. To describe step dynamics, we categorize each step into one of five groups for each time interval: (1) steps newly formed, (2) steps that expanded in the transversal direction, (3) steps that contracted in the transversal direction, (4) steps that remained the same, and (5) steps that were destroyed. We show the temporal trends of these categories in Fig. 7.

Figure 7Step activity in the feed experiments expressed as number of (a) total steps, (b) newly formed steps, (c) destroyed steps, (d) steps that have expanded, (e) steps that have contracted, and (f) steps that remained the same. The vertical dashed line separates the feed periods (on the left) from the no-feed periods (on the right).
This analysis revealed the following: (1) all experiments were very dynamic, as very few steps remained the same (Fig. 7f); (2) step formation and destruction were predominant during the feed phase and became less important when sediment feed was turned off (Fig. 7b, c); (3) step expansion and contraction varied considerably in all the runs, both with flow and sediment feed rate (Fig. 7d, e).
To assess the stability of channel morphology, we categorized steps that were formed and destroyed as events of channel instability and steps that contracted, expanded, or stayed the same as events of channel stability. We show the temporal trends of these categories in Fig. 8. Two observations emerge from this analysis. (1) Instability was predominant during the feed part of the experiments, but, as soon as the sediment supply was shut off, the modification of pre-existing steps became more important (i.e., the two time series in Fig. 8 became closer). (2) The difference between the instability and the stability of steps depends on sediment feed, as the two lines during the feed phase become more separated as the feed rate increases (i.e., moving from Fig. 8a to c). This separation indicates that larger sediment input enhances step formation and destruction. Turning off the sediment feed suppresses step formation and destruction, making changes to existing steps the predominant process of morphological change.
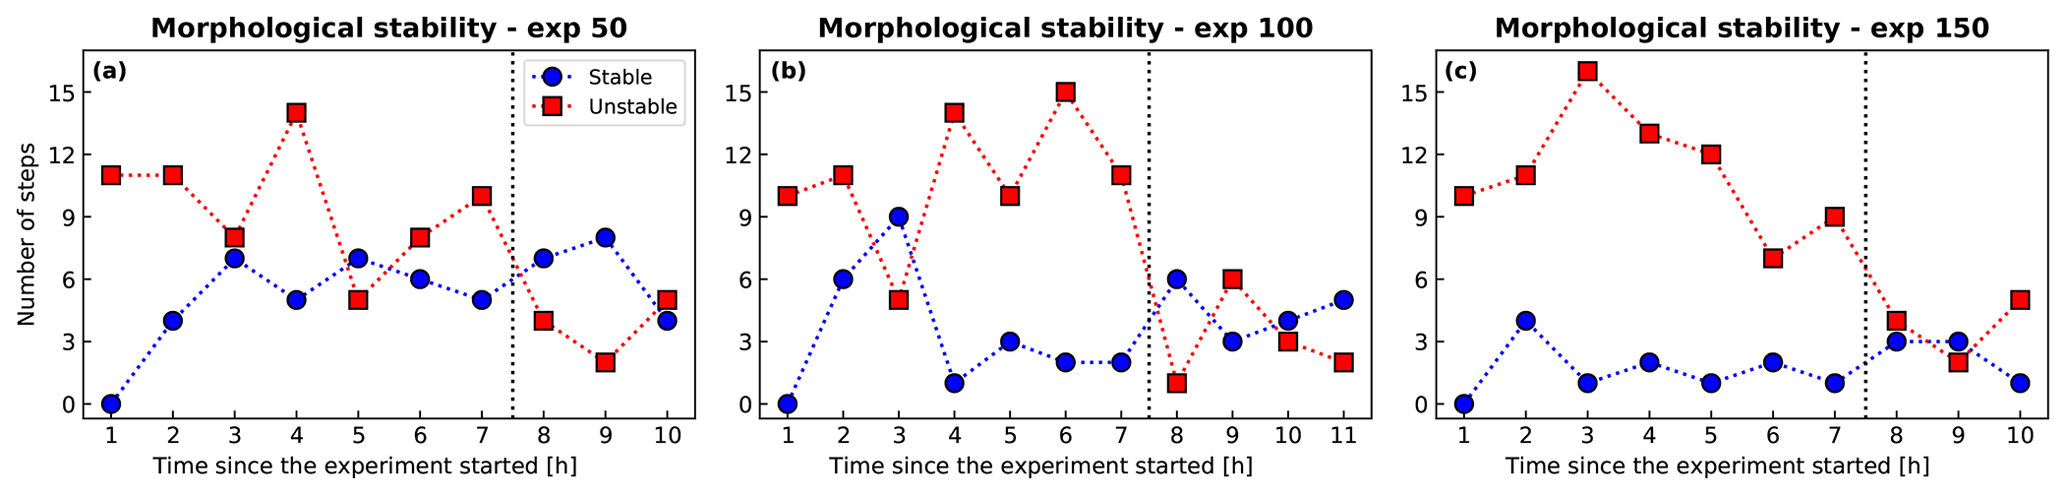
Figure 8Stability of the step-pool morphology in time expressed as comparison between number of steps that formed and destroyed (i.e., unstable in red squares) and number of steps that remained the same or expanded/contracted (i.e., stable in blue circles) in (a) Experiment 50, (b) Experiment 100, and (c) Experiment 150. The vertical dashed line separates the feed periods (on the left) from the no-feed periods (on the right).
The stability of steps can be explored also in terms of step survival time (i.e., for how many consecutive hours a step remains stable), and its dependence on the key variables explored in this study: the location within the channel and the magnitude of sediment supply. In Fig. 9, we show violin plots of survival times as a function of (a) step location and (b) feed rate. In the case of step location, the distribution of survival times demonstrates that steps in narrowing segments are more stable than those in other segments (Fig. 9a). None of the steps in narrow, wide, and widening segments survived for more than 5 h, whereas a few steps in the narrowing segments survived for the total duration of the experiment (i.e., 10 h). With respect to the relationship between survival times and feed rate (Fig. 9b), the maximum survival time occurs for Experiment 50, whose sediment feed rate is larger than zero but smaller than the calculated transport capacity. Both experiments with no-feed and with larger feed rates have smaller survival times. These trends suggest that step stability is enhanced when sediment supply is larger than zero but below transport capacity, an interesting point that will be addressed in the discussion.

Figure 9Violin plots of step survival times as a function of (a) step location and (b) sediment feed rate, with no-feed experiments shown for comparison.
3.4 Grain size and sediment yield
The grain-size distribution of the bed was obtained by analyzing the images and manually identifying 200 stones on a uniformly spaced grid. The time series of d16, d50, and d84 of the bed surface for the feed experiments are shown in Fig. 10. The d50 and the d16 did not change much during either of the three experiments, whereas the d84 was more dynamic, showing a consistent coarsening which became sharper 4–6 h into the experiments.
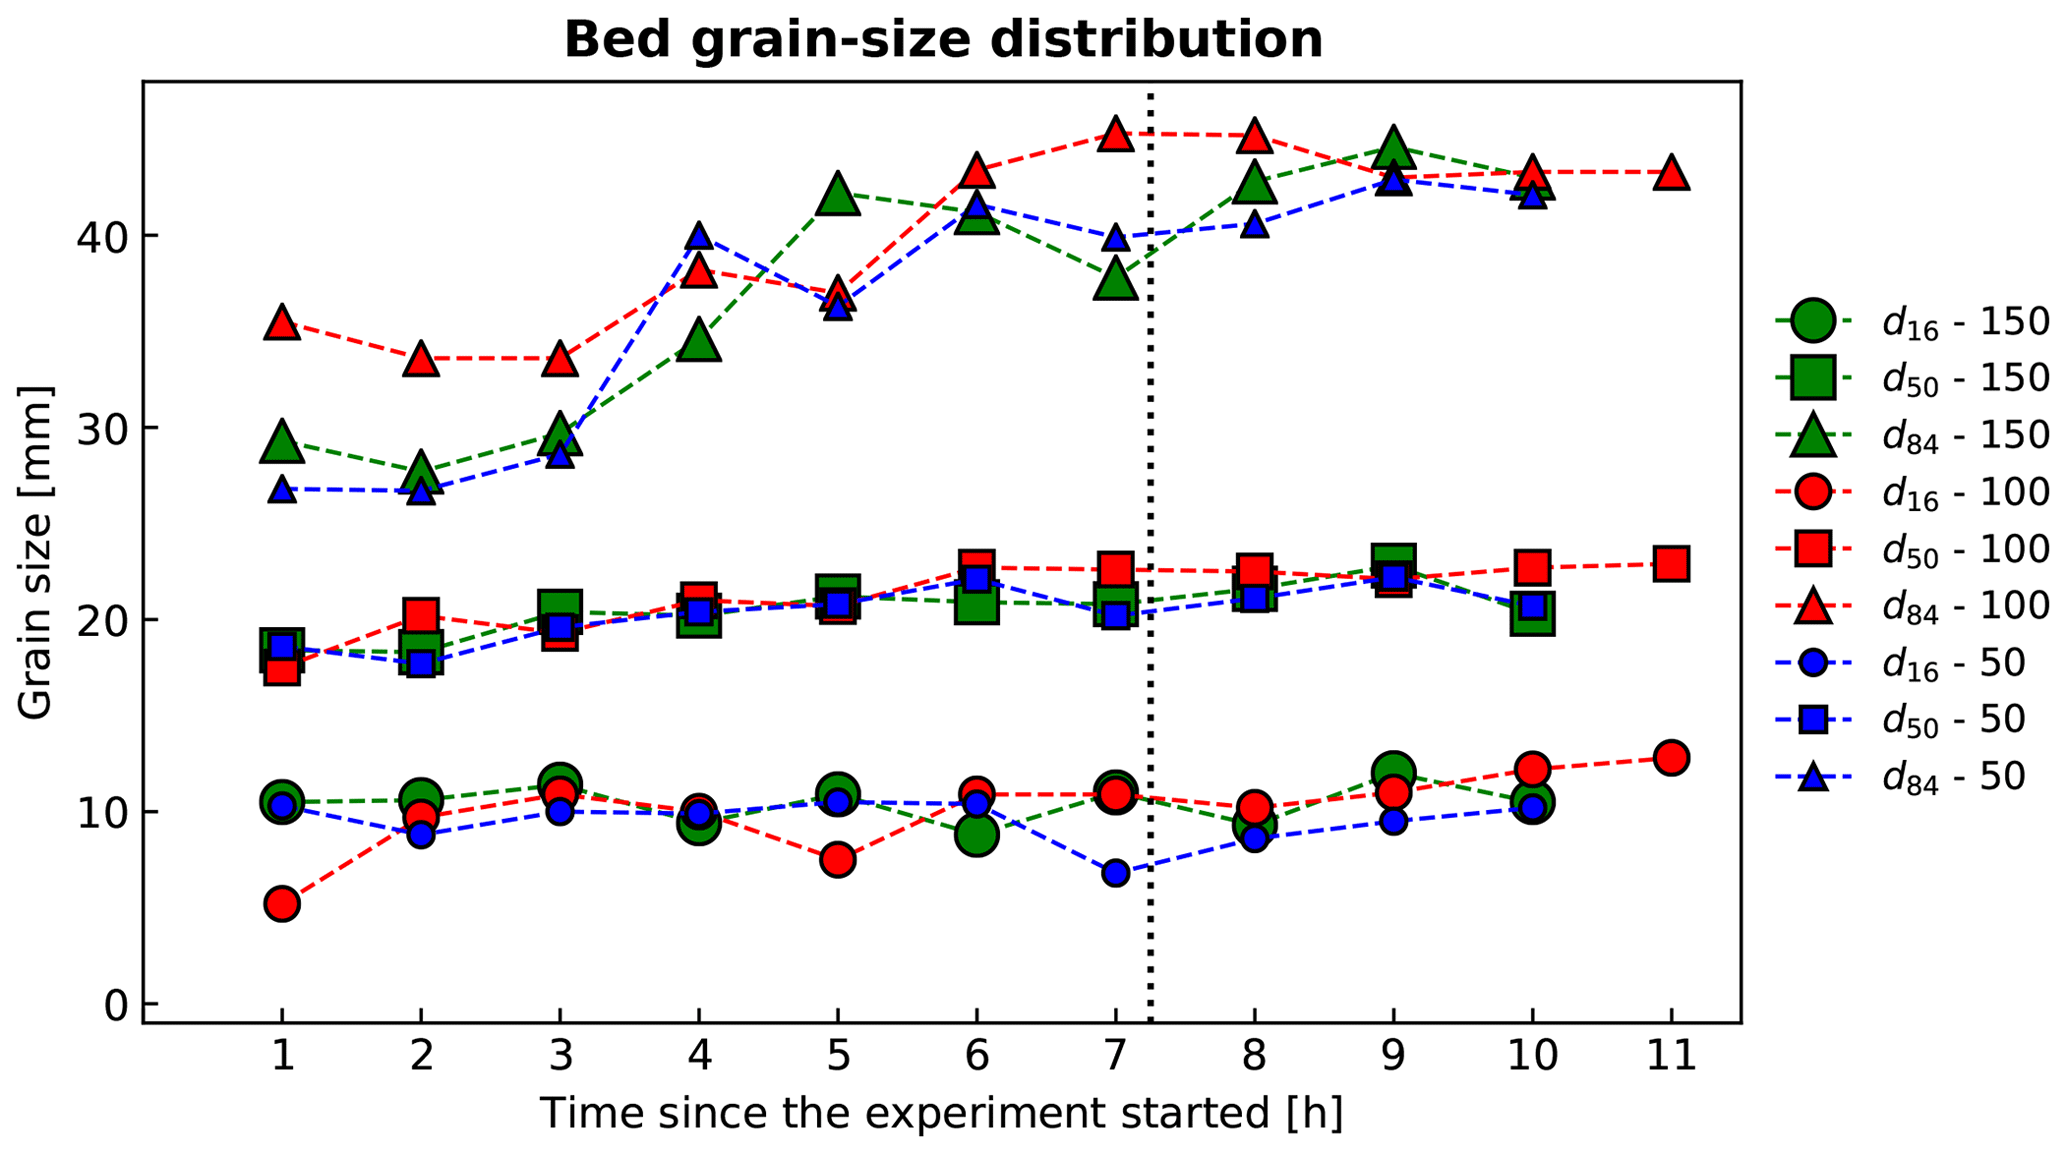
Figure 10Grain-size distribution of the bed surface for the feed experiments. The d16 is shown with circle, the d50 with squares, and the d84 with triangles. The size of the markers is proportional to the feed rate. The vertical dashed line indicates when the sediment feed was turned off.
The sediment yield measured at the flume outlet is dictated by the sediment feed at the inlet (Fig. 11). However, the correlation between sediment input and output does not mean that the channel morphology did not change, as evidenced by the observed step dynamics (Figs. 7–8). We evaluated the feed rates to be used in the experiments by calculating the channel transport capacity with the Wilcock and Crowe (2003) model. We expected net degradation in Experiment 50 (where we fed 50 % less than the calculated transport capacity) and net aggradation in Experiment 150 (where we fed 50 % more of the calculated transport capacity). This did not occur. In our experiments, the sediment transport rate at the flume outlet tracks the feed rate at the flume inlet closely. Surprisingly, in Experiment 150, there is more degradation than aggradation, as it can be seen in Fig. 11c, where sediment yield is almost always equal to or larger than the sediment feed.

Figure 11Sediment yield (red squares) measured at the channel outlet and sediment feed (blue circles) at the channel inlet in Experiments (a) 50, (b) 100, and (c) 150. The vertical dashed line indicates when the sediment feed was turned off.
3.5 Sediment concentration and step collapse
Considering that (a) we know the amount of sediment supplied to the channel, (b) we measured the amount of sediment that left the channel, and (c) we tracked all the steps that have been destroyed, it is possible to directly test the hypothesis proposed by Church and Zimmermann (2007) that a small sediment concentration is necessary for step stability. We calculated the sediment concentration cs in terms of both sediment feed () and sediment yield () as the ratio between solid and liquid discharge, and compared it with the fraction of steps that were destroyed in each run (number of steps destroyed at time t divided by the total number of steps at time t−1). We show these trends in Fig. 12, where sediment concentrations are plotted in log scale.

Figure 12Fraction of steps that were destroyed in each run as a function of the logarithm of sediment concentration of (a) sediment input and (b) sediment yield. Feed experiments are shown with circles (whose size is proportional to the feed rate), and no-feed experiments are shown with squares.
The fraction of destroyed steps increases with increasing sediment concentration. In the feed experiments, the trend is clearer when plotted using the sediment concentration of the output (R2=0.54 in Fig. 12b) than the sediment concentration of the input (R2=0.28 in Fig. 12a). Unlike what was proposed in the jammed-state hypothesis (Church and Zimmermann, 2007), we suggest that cs,yield should be used instead of cs,feed, as it is a better proxy for the particle activity that lead to step instability.
4.1 Width variations and step location
In the no-feed experiments of Saletti and Hassan (2020a), the authors demonstrated that longitudinal variations in channel width form steps in narrowing and narrow segments because of particle jamming, and that high flow rates scour away steps in narrow segments while preserving steps in narrowing segments. This outcome led to the conclusion that granular forces are predominant over fluid forces, since more steps occur in narrowing/narrow segments where the shear stress is larger and jamming ratio is smaller. The same behavior can be observed in the feed experiments reported here, where steps in narrowing segments are even more likely to occur than in the experiments without sediment feed (Fig. 6), and they are definitely more stable than steps in all other segments (Fig. 9). We attribute this outcome to the step-forming mechanism. Steps in narrowing segments are created by particle jamming enhanced by geometrical constraints, similarly to granular materials in a hopper (To et al., 2001). This process is strongly dependent on particle activity (i.e., the more particles that are in transport, the more likely they are to jam) which is a direct consequence of sediment supply. Based on these experiments, we should expect that when sediment feed is large enough to maintain an active level of sediment transport, more particles will jam, and more steps will be found in narrowing segments. This is consistent with the reduced-complexity modelling results of Saletti et al. (2016), where the frequency of step-creating jamming events is directly dependent on particle activity and sediment supply. More generally, this highlights the importance of considering granular effects and granular interactions in descriptions of channel morphology and sediment transport in steep, coarse-bedded streams (Booth et al., 2014; Ferdowsi et al., 2017; Frey and Church, 2011).
These experimental observations have important implications for step-pool design and mountain channel stability. They suggest that steps should be built where natural width constrictions favor keystone jamming to increase the success of stream restoration projects.
4.2 Step dynamics and channel stability
By tracking step evolution, we demonstrated that step-pool channels are more dynamic when subjected to sediment feed. During the feed experiments, when sediment was fed the dominant processes were step formation and collapse, whereas when sediment feed was turned off, contraction and expansion of existing steps became important (Figs. 7–8). These results are in agreement with the field study of Recking et al. (2012), who showed that natural step-pool channels directly connected to sediment sources have less stable steps (they are destabilized by smaller floods).
Our experiments showed that step instability (i.e., more steps collapsing) triggered by large sediment input does not necessarily mean fewer steps, as the increased particle activity implies also more step formation. For example, Fig. 4 shows how in some instances, Experiment 150 had more steps than Experiments 50 and 100, despite the larger sediment feed. As soon as the sediment input was turned off, both the numbers of steps that were created and destroyed clearly dropped in all three experiments. This confirms our starting hypothesis that particle activity (enhanced by sediment feed) is a key variable for step formation and stability.
We found that increasing sediment concentration caused more step collapses (Fig. 12), in agreement with the jammed-state hypothesis (Church and Zimmermann, 2007). Based on our results, we propose that sediment concentration in this context should be measured with respect to the sediment output rather than the input, since values of sediment yield are a better proxy for the degree of stability of the channel. Experiments conducted by Waters and Curran (2012) did not find a consistent relationship between sediment concentration and step collapse, although their study considered temporal stability of sequences rather than individual steps, and their flow rates remained constant for a longer period of time.
4.3 What maximizes step frequency?
Our experiments showed that the number of steps generated in feed experiments is larger than in otherwise equivalent no-feed experiments (Saletti and Hassan, 2020a). However, during feed experiments, the average number of steps decreased with feed rate (both in the same experiment and between different experiments). Our results suggest that there is an “optimum” level of sediment supply that maximizes the number of steps. The experiments suggest that the relation between step frequency and sediment supply can be conceptually expressed by a curve similar to that displayed in Fig. 1, where the maximum number of steps is achieved for values of sediment input larger than zero but smaller than the evaluated transport capacity. For lower values of sediment input, there is not enough sediment available to build this maximum number of steps (i.e., particle activity is too low). Instead, for higher values of sediment input, the system becomes too active (i.e., particle activity is too high), so that many steps form but they are immediately destroyed. Increasing values of sediment concentration showed an increasing fraction of steps destroyed (Fig. 12). However, the larger particle activity also increases the chances of step formation because of granular interactions. This yields the relationship displayed in Fig. 1, where the maximum number of steps is achieved for values of sediment feed below capacity but larger than zero.
Using the data from both the no-feed and the feed experiments, we show how step frequency changes as a function of sediment feed rate and location in terms of channel width (Fig. 13). To generalize our results, we show step frequency as number of steps per reach length expressed as number of average channel widths. We quantify the sediment supply with excess sediment feed, defined as the ratio between the sediment feed and the transport capacity (evaluated in our case with the model of Wilcock and Crowe, 2003). In Fig. 13, we plot both the average values from all our experiments and the 25th and 75th percentiles to show the variability around these values. The comparison between Fig. 13a and b suggests that the effect of width variations on step frequency is much stronger than that of sediment supply, although also much more variable.
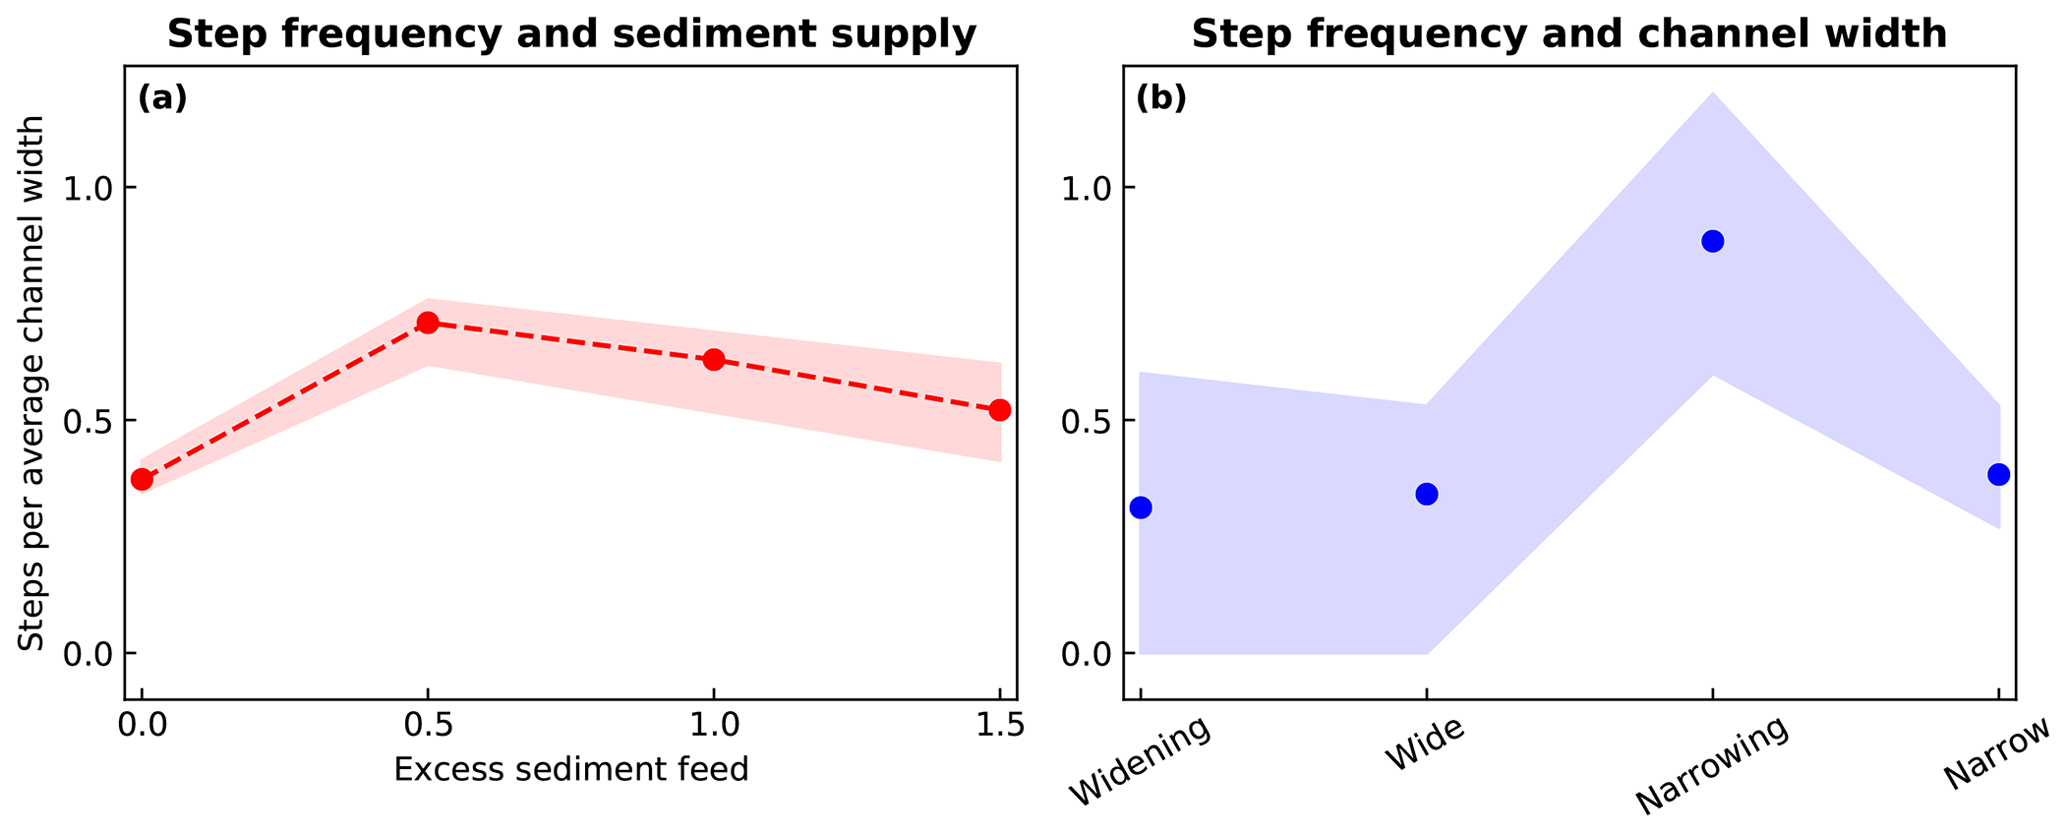
Figure 13Step frequency (expressed as number of steps per number of channel widths) plotted as a function of (a) sediment supply and (b) longitudinal channel width variation. Markers represent mean values, and the shaded area is the 25th–75th percentiles. The excess sediment feed in panel (a) is expressed as the sediment feed divided by the transport capacity.
It is important to note that sediment feed rate and longitudinal channel width variations are only two of the variables that influence step frequency. Flow rates and the hydrological regime (e.g., Zhang et al., 2019, 2018), grain-size distribution for the availability of large grains acting as keystones (e.g., Hohermuth and Weitbrecht, 2018), and channel geometry and slope (Chartrand et al., 2011) are also expected to be important controls. Sediment supply can also vary not only with respect to the magnitude but also in terms of duration and frequency (e.g., Hassan et al., 2020). Since in steep mountain channels the sediment input is often episodic, these aspects should be further investigated. Finally, channel width variations in steep channels are expected to occur in a less systematic way than those designed in our experiments, as well as with different angles and potentially with different material.
4.4 What is transport capacity in steep channels?
The values of sediment yield measured at the channel outlet during the experiments were very similar to the values of sediment feed imposed at the channel inlet (Fig. 11). The feed rates chosen in the three experiments spanned 1 order of magnitude and were below, equal to, and above the calculated transport capacity, yet the sediment yield was still determined by the supply. This suggests that (1) the channel adjusts its morphology to be able to carry the imposed load, and (2) standard formulations of transport capacity are not applicable in steep mountain channels where sediment transport rates are a function of the imposed feed and changes in channel morphology (e.g., Saletti et al., 2015).
It is important to note that this might be a consequence of the flume length. Changes in channel morphology and in storage and release of sediment could require longer flumes to be captured in physical experiments. Our flume length was ∼15 times the average channel width, a measure that is usually considered to be enough to represent a channel reach (Montgomery and Buffington, 1997, suggest, for example, 10–20 channel widths). However, these results would need to be tested in longer flumes in order to determine whether the pattern observed here depends on flume length or not.
4.5 Outlook
Our results highlight the important control of sediment supply and channel width variations on step formation, evolution, and stability in steep streams. However, some aspects deserve further investigations. First, these experiments were conducted under a constant feed rate, a condition that may not represent those typical of mountain streams, where mass movements and climate variability often make the sediment input highly variable. Therefore, experiments should be conducted with episodic sediment supply, to check whether and how this would influence the outcome. Second, this set of experiments did not explore other possibly important variables such as channel slope, angle of channel width variations, and grain-size distribution. Finally, to provide practitioners with a more quantitate criterion for step-pool channel design, precise measurements of flow depth, flow velocity, and flow structure should be taken. The combination of hydraulic and morphological variables will help to better understand the full set of conditions making steps unstable.
We reported results from flume experiments conducted to study the effect of sediment supply on the formation, evolution, and stability of steps in steep mountain streams subject to longitudinal width variations. Our feed experiments, together with no-feed experiments previously conducted in the same flume (Saletti and Hassan, 2020a), showed that more steps were created when sediment was fed into the channel; however, the number of steps was inversely related to the feed rate, suggesting that the maximum number of steps is achieved when sediment supply is below transport capacity.
Steps formed in different locations due to distinct mechanisms and with different likelihoods. Steps in narrow and especially narrowing segments were more likely to form due to particle jamming and remain more stable than steps due to particle deposition around keystones in wide and widening segments. This was more prevalent at high flow rates, when steps in narrowing segments were the predominant morphological feature in all experiments. This has important implications for stream restoration projects in steep streams, where step pools are often artificially designed to maintain channel stability and ecological functioning, especially during large floods.
The evolution of step formation, expansion/contraction, and destruction revealed that when sediment was fed into the channel, formation and destruction were the predominant means of channel evolution. However, when the input was turned off, changes in existing steps (i.e., expansion/contraction) became very similar to step formation and destruction, indicating that the channel seemed to have achieved a more stable morphology. The difference between the trends of expansion/contraction and formation/destruction was stronger for larger feed rates, confirming that sediment supply enhances particle activity and morphological changes.
The distributions of step survival showed that steps in narrowing segments were more stable than those in other segments. Channels subject to sediment feed rates smaller than the evaluated transport capacity had steps that were more stable than those generated both without and with larger values of sediment feed. This outcome, combined with step count results, led us to propose a conceptual model that relates step frequency to sediment supply in a functional way that resembles a bell curve. The maximum number of steps is achieved for values of sediment supply below transport capacity. The low particle activity due to no sediment input generates fewer steps, while the high particle activity due to high sediment input generates more steps that are more unstable.
Sediment yields tracked sediment input in all feed experiments, despite the order-of-magnitude variation in sediment feed rate. This observation suggests that the concept of transport capacity needs to be reevaluated in steep channels, where the magnitude of sediment supply seem to be the first-order control on sediment transport rates.
Finally, we compared data from feed and no-feed experiments to test the hypothesis proposed by Church and Zimmermann (2007) that a low sediment concentration is necessary to achieve step stability. Step instability in our experiments increased with sediment feed, especially when the sediment concentration was computed with respect to the sediment yield.
Our results help to better understand the important role of sediment input in the evolution of stepped channel morphology in steep streams, with the potential of being used by practitioners designing step-pool channels in stream restoration projects.
The data used in this paper are available in the following public repository: https://doi.org/10.5281/zenodo.3754767 (Saletti and Hassan, 2020b). Figures have been created with the matplotlib library in Python.
MS and MAH conceived the research and designed the experiment. MS carried out the experiments and analyzed the data under the supervision of MAH. Both authors wrote the paper.
The authors declare that they have no conflict of interest.
The authors thank Shawn M. Chartrand, J. Kevin Pierce, and Conor McDowell for fruitful discussions. Rick Ketler, David Waine, Conor McDowell, and Yarra Hassan (who sieved most of the sediment) helped with the experiments. J. Kevin Pierce and Conor McDowell provided careful reviews on previous drafts of this paper. The authors are grateful to the associate editor, Greg Hancock, and two anonymous reviewers for their help in improving the manuscript.
Matteo Saletti has been supported by a Swiss National Science Foundation (SNSF) (“Early PostDoc.Mobility”; grant no. P2EZP2_172206) and the Dean of Arts Postdoc Scholarship awarded to Marwan A. Hassan. Marwan A. Hassan has been supported by the Natural Sciences and Engineering Research Council (NSERC) Discovery and Canada Foundation for Innovation (CFI) grants (grant no. MH (RGPIN 249673-12)).
This paper was edited by Greg Hancock and reviewed by two anonymous referees.
Booth, A. M., Hurley, R., Lamb, M. P., and Andrade, J. E.: Force chains as the link between particle and bulk friction angles in granular material, Geophys. Res. Lett., 41, 8862–8869, https://doi.org/10.1002/2014GL061981, 2014. a
Bouchaud, J., Claudin, P., Levine, D., and Otto, M.: Force chain splitting in granular materials: A mechanism for large-scale pseudo-elastic behaviour, Eur. Phys. J. E, 4, 451–457, https://doi.org/10.1007/s101890170100, 2001. a
Chartrand, S. M., Jellinek, M., Whiting, P. J., and Stamm, J.: Geometric scaling of step-pools in mountain streams: Observations and implications, Geomorphology, 129, 141–151, https://doi.org/10.1016/j.geomorph.2011.01.020, 2011. a, b
Chin, A.: On the stability of step-pool mountain streams, J. Geol., 106, 59–69, https://doi.org/10.1086/516007, 1998. a
Chin, A.: On the origin of step-pool sequences in mountain streams, Geophys. Res. Lett., 26, 231–234, https://doi.org/10.1029/1998GL900270, 1999. a
Chin, A. and Wohl, E.: Toward a theory for step pools in stream channels, Prog. Phys. Geogr. Earth Environ., 29, 275–296, https://doi.org/10.1191/0309133305pp449ra, 2005. a
Chin, A., Anderson, S., Collison, A., Ellis-Sugai, B. J., Haltiner, J. P., Hogervorst, J. B., Kondolf, G. M., O'Hirok, L. S., Purcell, A. H., Riley, A. L., and Wohl, E.: Linking theory and practice for restoration of step-pool streams, Environ. Manage., 43, 645–661, https://doi.org/10.1007/s00267-008-9171-x, 2009. a, b
Church, M. and Zimmermann, A.: Form and stability of step-pool channels: research progress, Water Resour. Res., 43, W03415, https://doi.org/10.1029/2006WR005037, 2007. a, b, c, d, e, f, g, h, i
Comiti F. and Mao L.: Recent advances in the dynamics of steep channels, in: Gravel-bed Rivers, edited by: Church, M., Biron, P. M., and Roy, A. G., Wiley-Blackwell: Oxford, 353, https://doi.org/10.1002/9781119952497.ch26, 2012. a
Comiti, F., Cadol, D., and Wohl, E.: Flow regimes, bed morphology, and flow resistance in self-formed step-pool channels, Water Resour. Res., 45, W04424, https://doi.org/10.1029/2008WR007259, 2009a. a
Comiti, F., Mao, L., Lenzi, M. A., and Siligardi, M.: Artificial steps to stabilize mountain rivers: a post-project ecological assessment, River Res. Appl., 25, 639–659, https://doi.org/10.1002/rra.1234, 2009b. a
Comiti, F., Mao, L., Penna, D., Dell'Agnese, A., Engel, M., Rathburn, S., and Cavalli, M.: Glacier melt runoff controls bedload transport in Alpine catchments, Earth Planet. Sc. Lett., 520, 77–86, https://doi.org/10.1016/j.epsl.2019.05.031, 2019. a
Curran, J. C.: Step-pool formation models and associated step spacing, Earth Surf. Proc. Land., 32, 1611–1627, https://doi.org/10.1002/esp.1589, 2007. a, b
Ferdowsi, B., Ortiz, C. P., Houssais, M., and Jerolmack, D. J.: River-bed armouring as a granular segregation phenomenon, Nat. Commun., 8, 1363, https://doi.org/10.1038/s41467-017-01681-3, 2017. a
Frey, P., and Church, M.: Bedload: a granular phenomenon, Earth Surf. Proc. Land., 36, 58–69, https://doi.org/10.1002/esp.2103, 2011. a
Golly, A., Turowski, J. M., Badoux, A., and Hovius, N.: Controls and feedbacks in the coupling of mountain channels and hillslopes, Geology, 45, 307–310, https://doi.org/10.1130/G38831.1, 2017. a
Golly, A., Turowski, J. M., Badoux, A., and Hovius, N.: Testing models of step formation against observations of channel steps in a steep mountain stream, Earth Surf. Proc. Land., 44, 1390–1406, https://doi.org/10.1002/esp.4582, 2019. a, b, c, d
Grant, G. E., Swanson, F. J., and Wolman, M. G.: Pattern and origin of stepped-bed morphology in high gradient streams, Western Cascades, Oregon, Geol. Soc. Am. Bull., 102, 340–352, https://doi.org/10.1130/0016-7606(1990)102<0340:PAOOSB>2.3.CO;2, 1990. a
Hassan, M. A. and Church, M.: Experiments on surface structure and partial sediment transport on a gravel bed, Water Resour. Res., 36, 1885–1895, https://doi.org/10.1029/2000WR900055, 2000. a
Hassan, M. A., Saletti, M., Zhang, C., Ferrer-Boix, C., Johnson, J. P. L., Mueller, T., and von Flotow, C.: Co-evolution of coarse grain structuring and bed roughness in response to episodic sediment supply in an experimental aggrading channel, Earth Surf. Proc. Land., 45, 948–961, https://doi.org/10.1002/esp.4788, 2020. a, b
Hohermuth, B. and Weitbrecht, V.: Influence of bed-load transport on flow resistance of step-pool channels, Water Resour. Res., 54, 5567–5583, https://doi.org/10.1029/2017WR021523, 2018. a, b
Johnson, J. P. L.: Clustering statistics, roughness feedbacks, and randomness in experimental step-pool morphodynamics, Geophys. Res. Lett., 44, 3653–3662, https://doi.org/10.1002/2016GL072246, 2017. a
Johnson, J. P. L., Aronovitz, A. C., and Kim, W.: Coarser and rougher: Effects of fine gravel pulses on experimental step-pool channel morphodynamics, Geophys. Res. Lett., 42, 8432–8440, https://doi.org/10.1002/2015GL066097, 2015. a
Molnar, P., Densmore, A. L., McArdell, B. W., Turowski, J. M., and Burlando, P.: Analysis of changes in the step-pool morphology and channel profile of a steep mountain stream following a large flood, Geomorphology, 124, 85–94, https://doi.org/10.1016/j.geomorph.2010.08.014, 2010. a
Montgomery, D. R. and Buffington, J. M.: Channel-reach morphology in mountain drainage basins, Geol. Soc. Am. Bull., 109, 596–611, https://doi.org/10.1130/0016-7606(1997)109<0596:CRMIMD>2.3.CO;2, 1997. a, b
Piton, G., Carladous, S., Recking, A., Tacnet, J. M., Liebault, F., Kuss, D., Quefelean, Y., and Marco, O.: Why do we build check dams in Alpine streams? An historical perspective from the French experience, Earth Surf. Proc. Land., 42, 91–108, https://doi.org/10.1002/esp.3967, 2017. a
Recking, A., Leduc, P., Liebault, F., and Church, M.: A field investigation of the influence of sediment supply on step-pool morphology and stability, Geomorphology, 139–140, 53–66, https://doi.org/10.1016/j.geomorph.2011.09.024, 2012. a, b, c
Saletti, M. and Hassan, M. A.: Width variations control the development of grain structuring in steep step-pool dominated streams: insight from flume experiments, Earth Surf. Proc. Land., 45, 1430–1440, https://doi.org/10.1002/esp.4815, 2020a. a, b, c, d, e, f, g, h, i, j, k, l, m, n, o, p, q, r, s, t, u, v, w
Saletti, M. and Hassan, M. A.: Flume experiments on the effects of sediment feed rates on step formation, evolution and stability [Data set], Zenodo, https://doi.org/10.5281/zenodo.3754767, 2020b. a
Saletti, M., Molnar, P., Zimmermann, A. E., Hassan M. A., and Church, M.: Temporal variability and memory in sediment transport in an experimental step-pool channel, Water Resour. Res., 51, 9325–9337, https://doi.org/10.1002/2015WR016929, 2015. a, b
Saletti, M., Molnar, P., Hassan, M. A., and Burlando P.: A reduced-complexity model for sediment transport and step-pool morphology, Earth Surf. Dynam., 4, 549–566, https://doi.org/10.5194/esurf-4-549-2016, 2016. a, b, c, d, e
Thomas, D. B., Abt, S. R., Mussetter, R. A., and Harvey, M. D.: A Design Procedure for Sizing Step-Pool, Building Partnerships, 1–10, https://doi.org/10.1061/40517(2000)340, 2000. a
To, K., Lai, P. Y., and Pak, H. K.: Jamming of Granular Flow in a Two-Dimensional Hopper, Phys. Rev. Lett., 86, 71–74, https://doi.org/10.1103/PhysRevLett.86.71, 2001. a
Turowski, J. M., Yager, E. M., Badoux, A., Rickenmann, D., and Molnar, P.: The impact of exceptional events on erosion, bedload transport and channel stability in a step-pool channel, Earth Surf. Proc. Land., 34, 1661–1673, https://doi.org/10.1002/esp.1855, 2009. a, b
Venditti, J. G., Nelson, P. A., Bradley, R. W., Haught, D., and Gitto, A. B.: Bedforms, Structures, Patches, and Sediment Supply, in: Gravel-Bed Rivers: Processes and Disasters, John Wiley, 2017. a
Waters, K. A. and Curran, J. C.: Investigating step-pool sequence stability, Water Resour. Res., 48, W07505, https://doi.org/10.1029/2011WR011436, 2012. a, b, c
Wilcock, P. R. and Crowe, J. C.: Surface-based transport model for mixed-size sediment, J. Hydraul. Eng.-ASCE, 129, 120–128, https://doi.org/10.1061/(ASCE)0733-9429(2003)129:2(120), 2003. a, b, c
Yager, E. M., Kirchner, J. W., and Dietrich, W. E.: Calculating bed load transport in steep boulder bed channels, Water Resour. Res., 43, W07418, https://doi.org/10.1029/2006WR005432, 2007. a
Yager, E. M., Schmeeckle, M. W., and Badoux, A.: Resistance is not futile: Grain resistance controls on observed critical Shields stress variations, J. Geophys. Res.-Ea. Surf., 123, 3308–3322, https://doi.org/10.1029/2018JF004817, 2018. a
Yu, G., Wang, Z., Zhang, K., Duan, X., and Chang, T.: Restoration of an incised mountain stream using artificial step-pool system, J. Hydraul. Res., 48, 178–187, https://doi.org/10.1080/00221681003704186, 2010. a
Zhang, C., Xu, M., Hassan, M. A., Chartrand, S. M., and Wang, Z.: Experimental study on the stability and failure of individual step-pools, Geomorphology, 311, 51–62, https://doi.org/10.1016/j.geomorph.2018.03.023, 2018. a, b
Zhang, C., Xu, M., Hassan, M. A., Chartrand, S., Wang, Z., and Ma, Z.: Experiment on hydraulic and morphological adjustments of step-pool to flow changes, Earth Surf. Proc. Land., 45, 280–294, https://doi.org/10.1002/esp.4722, 2019. a, b
Zimmermann, A. E.: Flow resistance in steep streams: an experimental study, Water Resour. Res., 46, W09536, https://doi.org/10.1029/2009WR007913, 2010. a
Zimmermann, A. E., Church, M., and Hassan, M. A.: Video-based gravel transport measurements with a flume mounted light table, Earth Surf. Proc. Land., 33, 2285–2296, https://doi.org/10.1002/esp.1675, 2008a. a
Zimmermann, A. E., Church, M., and Hassan, M. A: Identification of steps and pools from stream longitudinal profile data, Geomorphology, 102, 395–406, https://doi.org/10.1016/j.geomorph.2008.04.009, 2008b. a
Zimmermann, A. E., Church, M., and Hassan, M. A.: Step-pool stability: testing the jammed state hypothesis, J. Geophys. Res., 115, F02008, https://doi.org/10.1029/2009JF001365, 2010. a, b, c, d