the Creative Commons Attribution 4.0 License.
the Creative Commons Attribution 4.0 License.
 | 16 Nov 2022
Comparison of calibration characteristics of different acoustic impact systems for measuring bedload transport in mountain streams
Dieter Rickenmann
Lorenz Ammann
Tobias Nicollier
Stefan Boss
Bruno Fritschi
Gilles Antoniazza
Nicolas Steeb
Zheng Chen
Carlos Wyss
Alexandre Badoux
The Swiss plate geophone (SPG) system has been installed and tested in more than 20 steep gravel-bed streams and rivers, and related studies generally resulted in rather robust calibration relations between signal impulse counts and transported bedload mass. Here, we compare this system with three alternative surrogate measuring systems. A variant of the SPG system uses the same frame (housing) set-up but with an accelerometer instead of a geophone sensor to measure the vibrations of the plate (GP-Acc, for geophone plate accelerometer). The miniplate accelerometer (MPA) system has a smaller dimension of the impact plate and is embedded in more elastomer material than the SPG system. The Japanese pipe microphone (JPM) is a 1 m long version of the system that has been installed in many streams in Japan. To compare the performance of the four systems, we used calibration measurements with direct bedload samples from three field sites and an outdoor flume facility with controlled sediment feed. At our field sites, the systems with an accelerometer and a microphone showed partly large temporal variations in the background noise level, which may have impaired the calibration measurements obtained during certain time periods. Excluding these periods, the SPG, GP-Acc, and JPM all resulted in robust calibration relations, whereas the calibration of the MPA system showed a poorer performance at all sites.
- Article
(7981 KB) - Full-text XML
-
Supplement
(2996 KB) - BibTeX
- EndNote


The measurement of bedload transport in steep streams is a difficult task (e.g. Gray et al., 2010; Rickenmann, 2017a). This is particularly true regarding direct measurements that typically have a limited resolution in space and time and that are sometimes challenging to achieve for higher streamflow and transport conditions. Direct bedload sampling includes the use of retention basins, slot samplers, or mobile basket samplers (e.g. Helley and Smith, 1971; Gray et al., 2010), limited by factors such as sampler capacity (e.g. Habersack et al., 2017; Nicollier et al., 2021), flow conditions (e.g. Bunte et al., 2004), or bed material texture (Camenen et al., 2012). Physical traps and samplers provide a sample of bedload particles transported into the measuring devices during a known period. While some methods allow the entire grain size distribution of the bedload particles transported over the entire stream width to be collected, other methods only sample fractions of the transported bedload or grain sizes (Aberle et al., 2017).
To overcome some of the limitations associated with direct bedload measurements in steep streams, increasing efforts were made in the last decades to apply and test “indirect” or surrogate monitoring techniques (e.g. Rickenmann, 2017a, b; Gimbert et al., 2019; Geay et al., 2020) that particularly include passive acoustic measurements of bedload transport. These systems essentially record naturally generated noise signals, i.e. the sound or vibration induced by moving bedload particles. A critical advantage of indirect monitoring techniques lies in their ability to record a bedload signal continuously in time, including during flood flows, and over an entire channel cross-section to provide detailed spatial information. However, the calibration of passive acoustic measurements typically requires concurrent sampling measurements of bedload transport, preferably collected at the same field site where the passive acoustic sensors are deployed.
Passive acoustic or seismic monitoring techniques include the hydrophone, i.e. an underwater microphone (Thorne, 1986, 2014; Geay et al., 2017, 2020); the Japanese pipe microphone (JPM) (Mizuyama et al., 2010a, b; Mao et al., 2016; Tsutsumi et al., 2018; Choi et al., 2020); the impact plate (e.g. Rickenmann and McArdell, 2007; Krein et al., 2008; Raven et al., 2010; Hilldale et al., 2015; Wyss et al., 2016a; Kuhnle et al., 2017; Koshiba et al., 2018; Nicollier et al., 2022b); and the seismometer (Roth et al., 2016; Dietze et al., 2019; Gimbert et al., 2019; Bakker et al., 2020). The main sources of sediment-related noise detected by hydrophones are inter-particle collisions among moving particles or between moving particles and the streambed (Thorne, 1986, 2014). The measuring devices that record the impacts of sediment particles onto a (metallic) structure (i.e. a pipe, a plate, or a cylinder) use further types of sensors (i.e. geophones, accelerometers, and piezoelectric sensors) to measure the vibrations of the structure (Rickenmann, 2017a). Seismometers are typically installed on streambanks and primarily record seismic waves generated by the transport of larger particles and the turbulent water flow (Dietze et al., 2019).
Many studies summarize successful investigations with the impact plate systems in the field and within the frame of controlled flume experiments (e.g. Bogen and Møen, 2003; Krein et al., 2008; Tsakiris et al., 2014; Mao et al., 2016; Wyss et al., 2016b, c; Kuhnle et al., 2017). Among these systems, the Swiss plate geophone (SPG) system was installed and tested in more than 20 steep gravel-bed streams and rivers, mostly in the European Alps (Rickenmann, 2017a; Nicollier et al., 2021, 2022b). For the SPG, linear and power-law calibration relationships were developed between measured signal properties and bedload transport rate or mass (Rickenmann et al., 2014, 2020; Rickenmann and Fritschi, 2017; Habersack et al., 2017; Wyss et al., 2016a; Kreisler et al., 2017; Kuhnle et al., 2017; Nicollier et al., 2021, 2022b; Coviello et al., 2022). There are similarities between calibration relationships based on bedload samples at various field sites, but it is not well understood why the linear calibration coefficients for total mass flux can vary by about a factor of 20 among individual samples from different sites or by about a factor of 6 among the mean values from different sites (Rickenmann et al., 2014; Rickenmann and Fritschi, 2017). Impact tests and controlled flume experiments allowed the grain size distribution to be identified as one reason for the variability in the signal response (Nicollier et al., 2021). Another reason explaining a part of the variability is the lateral signal propagation that occurs when medium-sized to larger particles impact on different locations of a neighbouring plate or on the nearby concrete bed (Antoniazza et al., 2020; Nicollier et al., 2022a; Chen et al., 2022a). Furthermore, both field (Rickenmann et al., 2014) and flume (Wyss et al., 2016b; Kuhnle et al., 2017; Nicollier et al., 2021) observations showed that the flow velocity also plays an important role for the impulse-based calibration factor (see also Nicollier et al., 2022a, b).
Most calibration relations for impact-type acoustic monitoring techniques such as the SPG were based on an analysis of the signal in the time domain (e.g. by impulse counts above a threshold level excluding the system noise). Several studies with controlled flume experiments using such systems showed that the signal amplitude contains information about the grain size of the transported bedload and enables the detection of particles as small as about 5 to 10 mm (Beylich and Laute, 2014; Mao et al., 2016; Wyss et al., 2016a). Some studies further indicated that the size of the transported bedload particles can also be related to the frequency content of the signal registered by acoustic sensors (Bogen and Møen, 2003; Barrière et al., 2015; Wyss et al., 2016b; Rickenmann, 2017a). A combination of both amplitude and characteristic frequency potentially represents a more robust identification of the transported particle sizes (Barrière et al., 2015; Wyss et al., 2016b; Nicollier et al., 2022a, b).
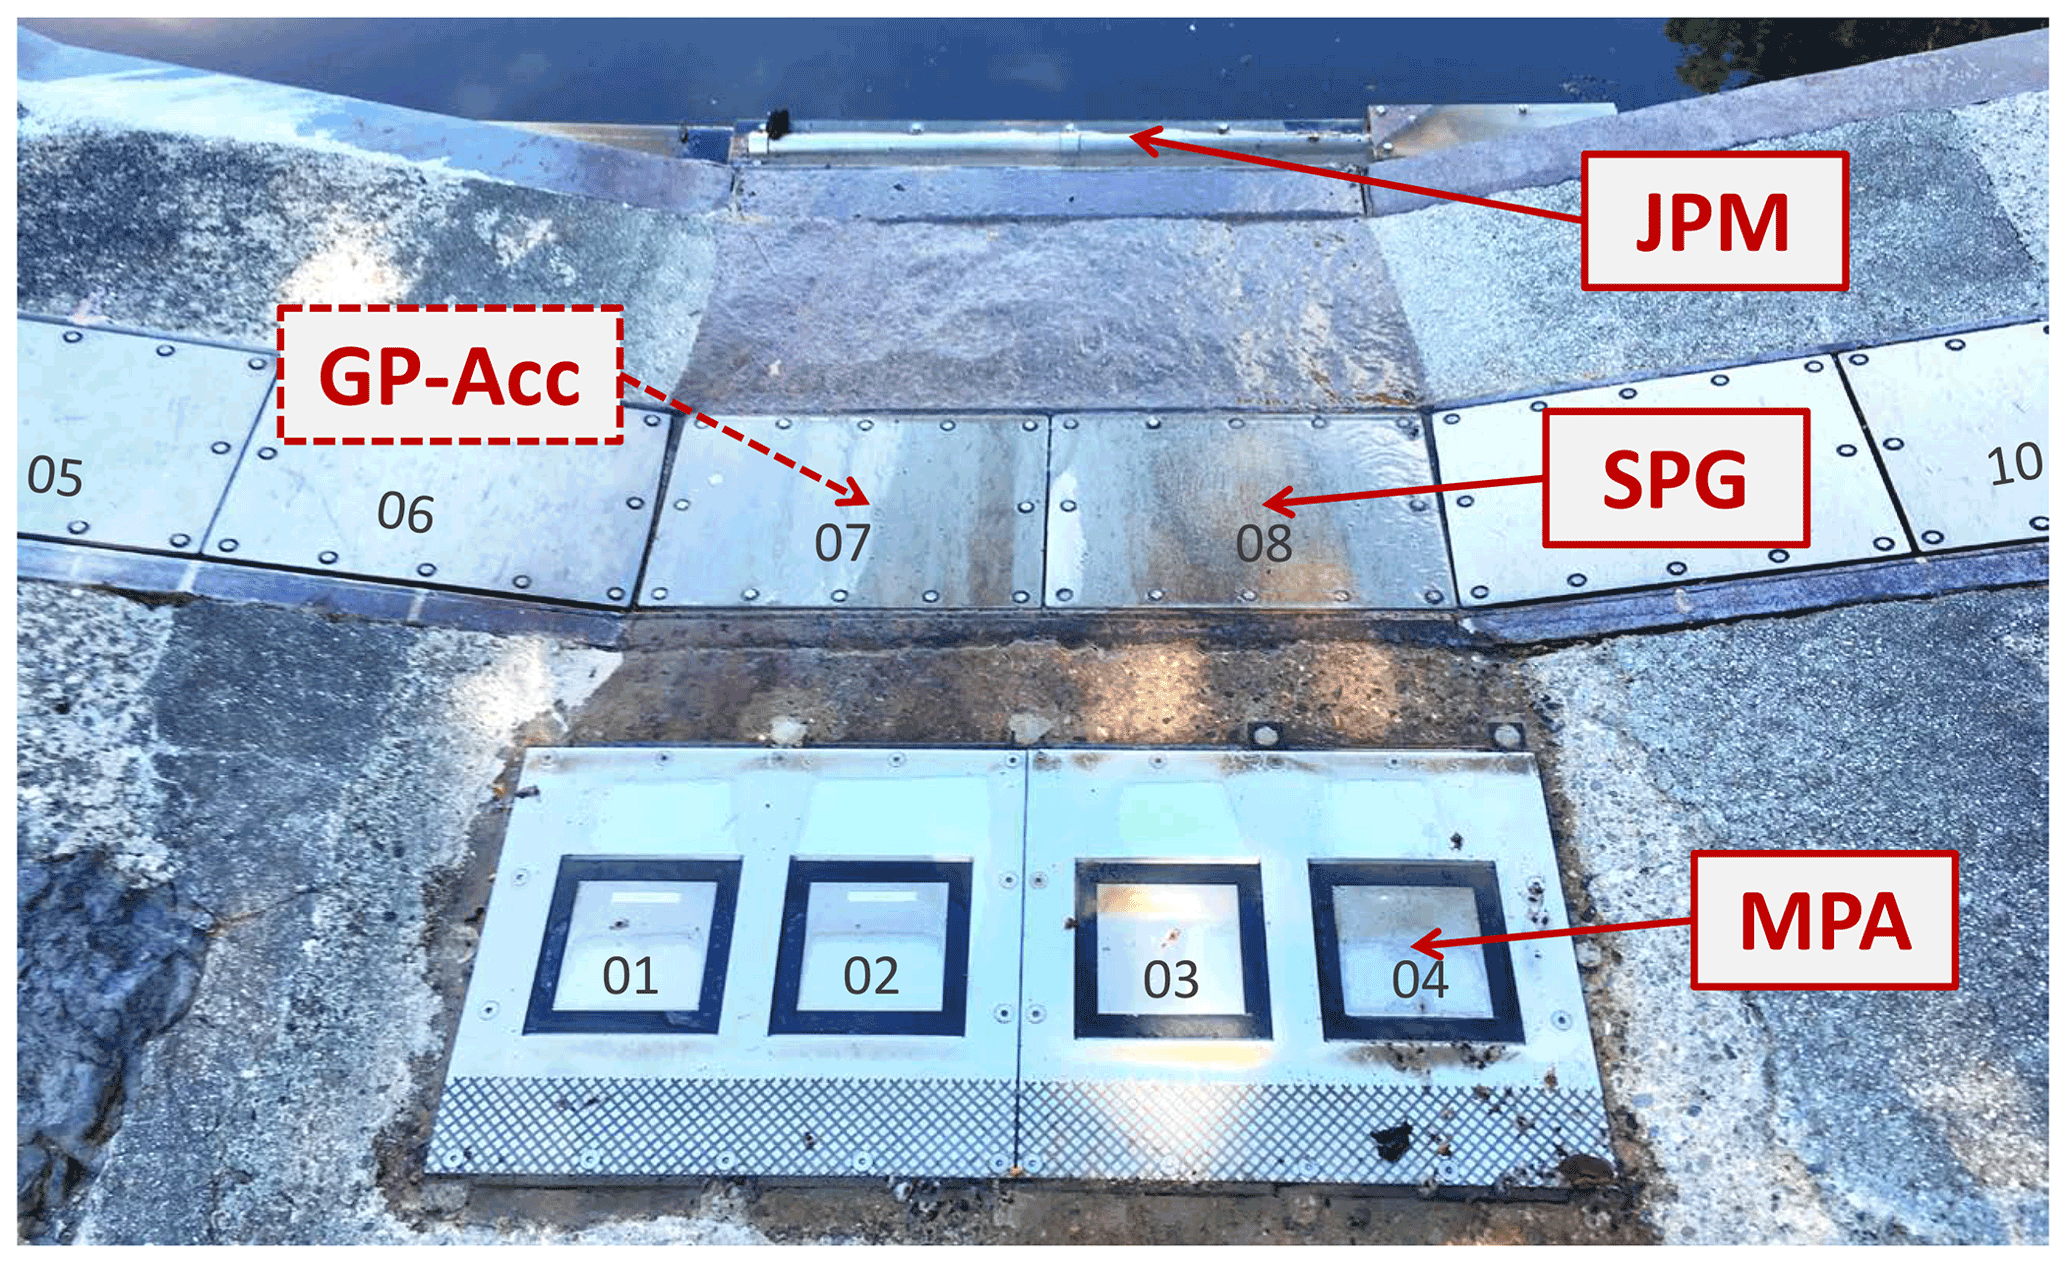
Figure 1The four acoustic measuring systems considered in this study: (i) the Swiss plate geophone (SPG); (ii) a variant of the SPG system, where the steel plate is equipped with an accelerometer sensor instead of a geophone sensor (GP-Acc); (iii) the miniplate accelerometer (MPA); and (iv) the Japanese pipe microphone (JPM). The set-up in this picture is the one at the Erlenbach stream in Switzerland (with flow direction into the retention basin from bottom to top). Numbers in dark grey refer to plate numbers. The measuring devices are installed in an artificial, 35 m long approach flow channel to the sediment retention basin, made up of concrete in the lowest part and of riprap blocks embedded in cement in the upper reach.
The goal of this study is to compare the performance of four surrogate acoustic measuring systems for bedload transport in reference to direct bedload measurements. These four acoustic measuring systems are (i) the SPG, on which many studies of the Swiss Federal Research Institute (WSL) and other research groups focused in the past 20 years; (ii) the miniplate accelerometer (MPA), a smaller variant of the SPG system developed by WSL; (iii) the GP-Acc (for geophone plate accelerometer), which uses the same frame as the SPG system but is equipped with an accelerometer sensor instead of a geophone sensor; and (iv) the Japanese pipe microphone (JPM), a system which has been installed in many mountain streams in Japan. An illustration of the four measuring systems is presented in Fig. 1, showing the devices as installed at the Erlenbach stream. Calibration measurements for the surrogate systems were obtained at four locations, namely at three field sites in the Swiss Alps – the Erlenbach and Avançon de Nant streams and the Albula river – and at an outdoor flume facility in Obernach (Germany), allowing for controlled flow conditions and sediment feeding during the experiments. In this paper, we discuss the temporal stability of the signal (noise) under non-bedload transport conditions and the quality of the calibration relationships obtained from the direct bedload measurements, and we identify some possible reasons for the poorer performance of the MPA as compared to the other investigated systems.
2.1 Surrogate measuring systems
The four surrogate measuring systems SPG, MPA, GP-Acc, and JPM were deployed in this study. The first three systems were developed at our research institute WSL, whereas the JPM was purchased from Japan. The major dimensions of the impact systems are depicted in Fig. 2. Some preliminary tests were made at the Obernach outdoor flume with a new prototype measuring device, the so-called square pipe system (SPS) (Fig. 2).
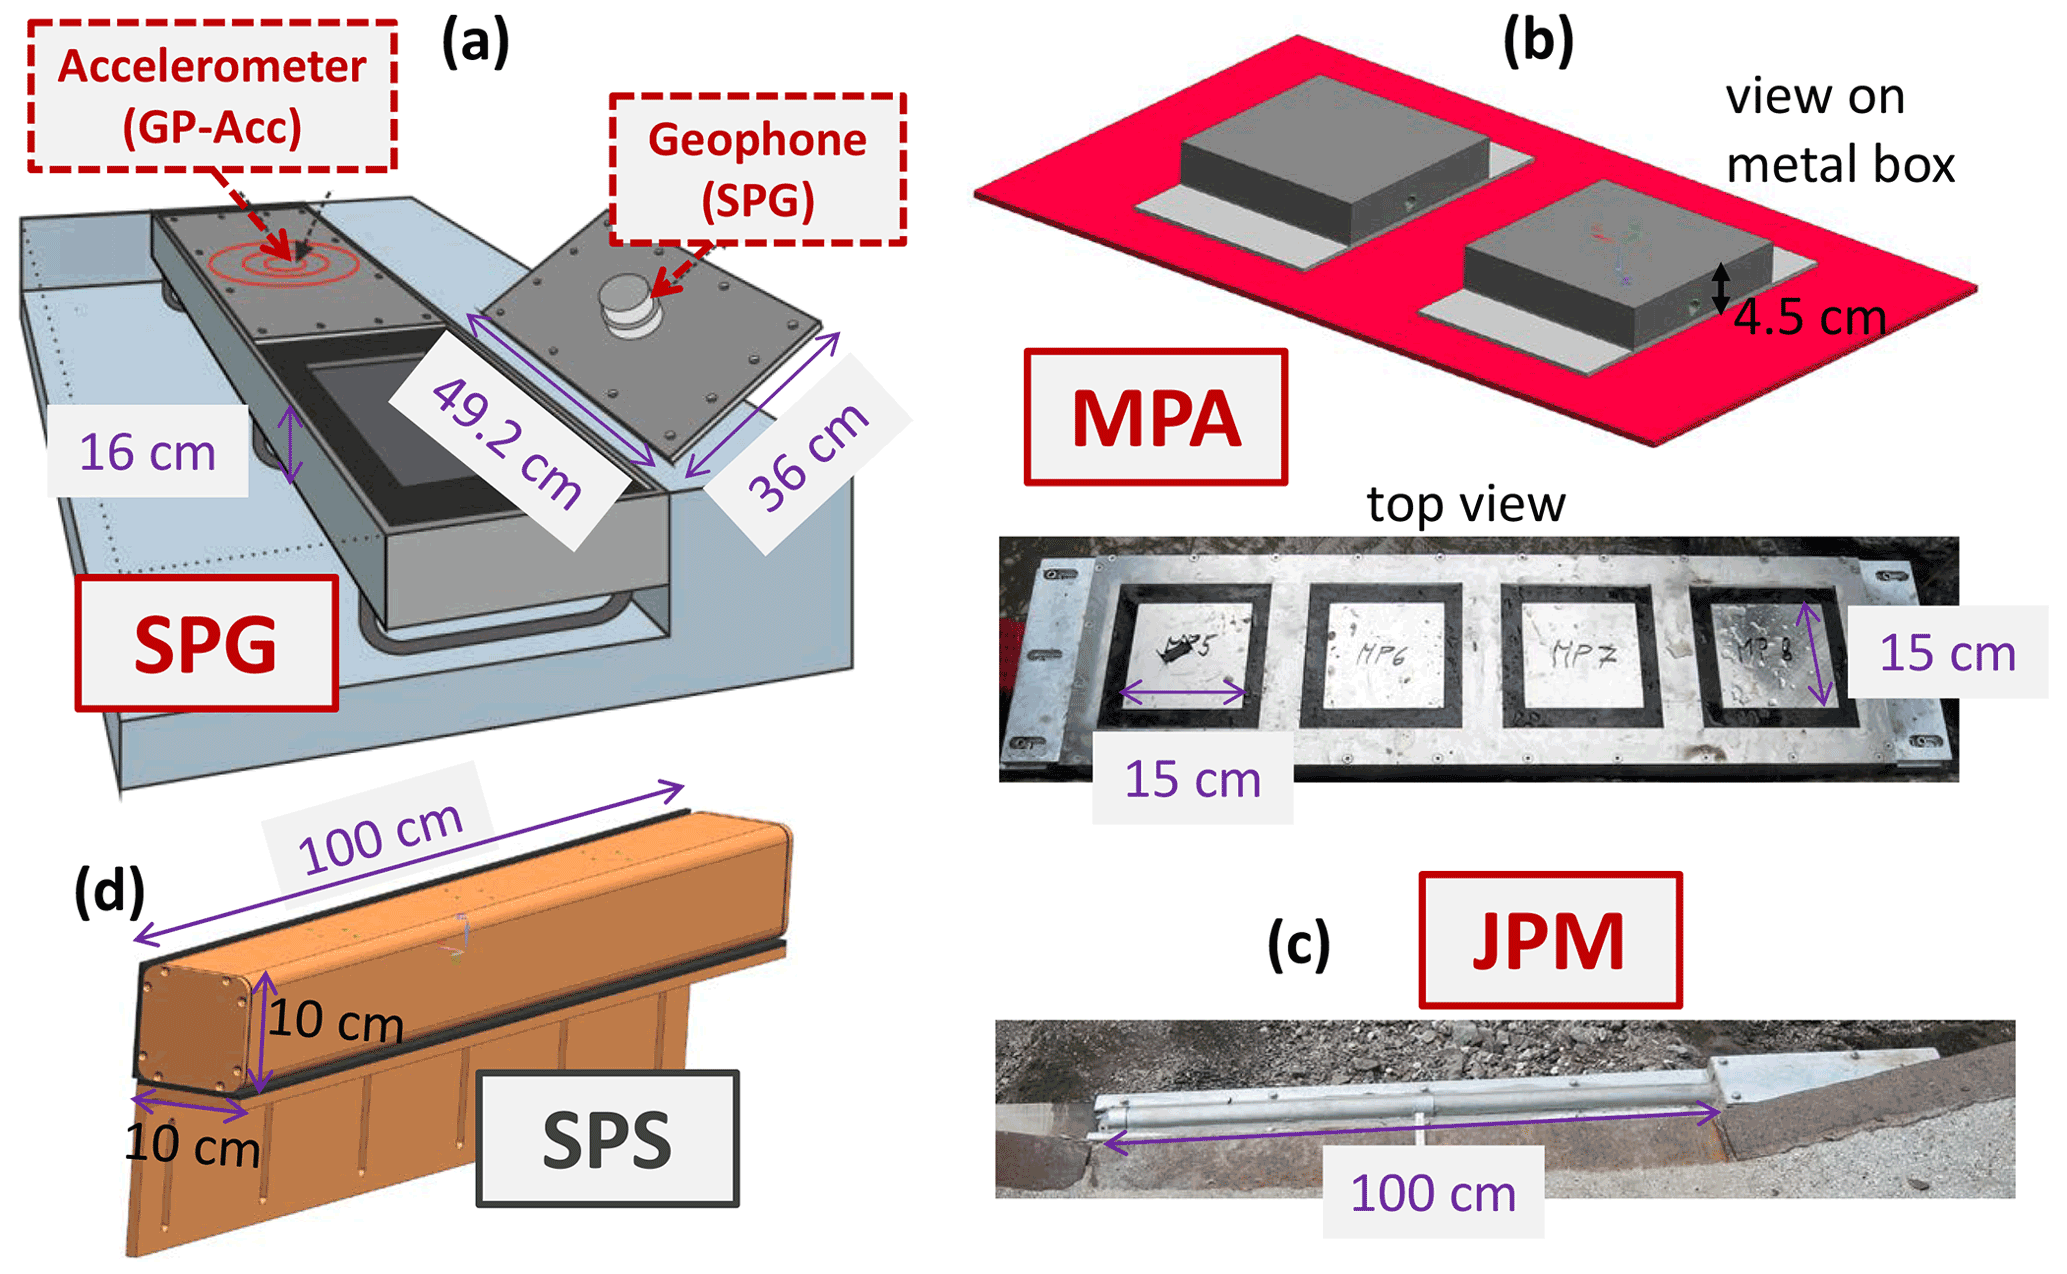
Figure 2Sketches with the main dimensions of the four systems. For (a) the SPG and (b) the MPA, the plate thickness is 15 and 8 mm, respectively. For (c) the JPM, the pipe diameter is 48 mm, and its wall thickness is 3 mm. The (d) SPS is a new prototype system (with preliminary test results), and the wall thickness of the square steel pipe is 8 mm.
The SPG system consists of a steel plate mounted flush with the streambed and equipped with a geophone sensor fixed from underneath in the centre of the plate. The steel plate has standard dimensions of m × 0.492 m × 0.015 m, where L is the downstream length, W is the transversal width, and T is the thickness of the steel plate. A 20DX geophone from Geospace Technologies (Houston, Texas, USA) in a PC801 LPC land case is fixed in a water-tight aluminium case to the bottom of the steel plate. The geophone sensor measures impact shocks generated by bedload particles moving over and impacting the plate. The sensor contains a magnet in a coil as inductive element. The relative movement between the coil and the magnet induces a current proportional to the velocity of the impacted plate (Rickenmann et al., 2012). The output range of the sensor is ±10 V (Table 1). Each plate covers a unit stream width of 0.5 m, and multiple steel plates are often mounted side by side into a steel canal frame, one segment typically covering 2.5 to 3 m of stream width. The plates are acoustically isolated from each other and from the steel canal by elastomer elements in which they are embedded to minimize the recording of extraneous vibrations (e.g. from particle impacts on neighbouring plates or on the concrete up- or downstream of the steel canal).
Table 1Sensor types used in the measurement systems in this study and their respective output range.
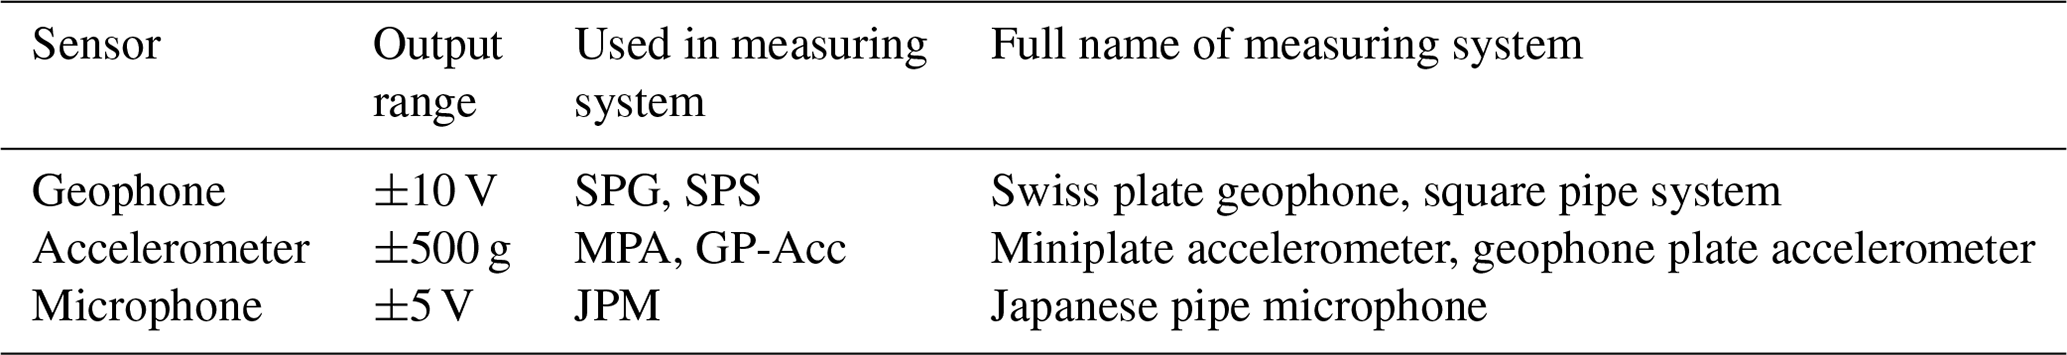
The GP-Acc is a variant of the Swiss plate geophone system, using the same steel frame set-up but with an accelerometer instead of a geophone sensor to measure the vibrations of the plate. A general-purpose accelerometer model KS78.10 from Metra Mess- und Frequenztechnik (Radebeul, Germany) was installed, with an output range of ±500 g (Table 1). Calibration measurements with the GP-Acc were made in two slightly different set-ups: at the Erlenbach stream, the accelerometer sensor was mounted next to the geophone sensor under the same impact plate, and at the Albula stream every second plate was equipped with either a geophone or an accelerometer sensor (see also Table 2).
Table 2Main characteristics of raw data acquisition and processing for the different measuring systems. The listed threshold value Amin was used for the processing of the raw data. The Amin value in square brackets refers to the threshold value used for impulse counts for the continuous storage of the summary values in minute intervals; if no square bracket is present, the listed Amin value was used for the calculation of the summary values. Down-sampling of the original sampled signal was made for the analysis of this study for better comparability between measuring systems and calibration locations. V: volt; g: gravitational acceleration.

The MPA system was developed with the idea of constructing a more compact system than the SPG. In addition, it may be expected that the MPA and GP-Acc systems can better detect smaller particles than the SPG system, since an accelerometer is designed to better pick up higher frequencies (above about 1 kHz) than a geophone sensor. The core unit of the MPA system is a metal box that houses an accelerometer sensor, mounted at the underside and in the centre of a compact steel box. The bottom part of the box is closed by a thin steel plate of somewhat larger dimensions than the top surface with dimensions of m × 0.150 m × 0.008 m (Fig. 2). The entire metal structure is embedded in elastomer layers and partly covered by a metal frame to be robust against forces generated by the water flow and bedload particle transport. The sensor used is the miniature adhesive-mount IEPE (Integral Electronics Piezo-Electric) accelerometer model 805M1 from Measurement Specialties (Aliso Viejo, CA, USA), with an output range of ±500 g (Table 1). The MPA system is somewhat similar in terms of plate dimension and sensor type to the impact plate system used primarily in UK studies (Downs et al., 2016; Raven et al., 2009, 2010; Reid et al., 2007; Richardson et al., 2003), although this latter system was fixed more rigidly to the streambed.
Finally, the Japanese pipe microphone (JPM) is a system that was developed in Japan by Hydrotech (Kouzukeda, Shiga, Japan). At the various Japanese field sites, it is typically placed transversally to the flow direction across the streambed and buried by roughly half its diameter in cement at a stable bed section such as a check dam or a sill (Mizuyama et al., 2010a, b). For the installation at the Erlenbach stream, we embedded the pipe in elastomer layers so that about 40 % of the upper pipe surface was exposed to the flow. In this way, we wanted to guarantee a stable configuration of the exposed pipe surface, not influenced by a possibly degrading cement layer over time. The steel pipe is filled with air, and a microphone records the sound (pressure waves) generated by particles impacting the pipe. In most studies that used the JPM, the raw signal is first treated with a band-pass filter, and a wave detector determines the envelope of the signal. Based on the envelope, the number of waves or wave peaks exceeding the threshold level is used to derive the pulse counts (Tsutsumi et al., 2018). Note that the pulse counting is very similar to the counting of signal packets as described in studies with the SPG system; a packet is defined as a continuous time section of the signal corresponding to one impact of a bedload particle (Wyss et al., 2016a; Nicollier et al., 2022b). For the observations presented in this study, we recorded the raw signal of the microphone and analysed it in the same way as for the other three systems (see Sect. 2.2 below). The output range of the microphone is ±5 V (Table 1).
As a result of the experience with several surrogate bedload monitoring systems, we have recently developed the new prototype measuring system SPS. This device is more compact and cheaper in fabrication and installation costs than the SPG but is expected have a similar performance. For the Obernach experiments, it was equipped with two geophone sensors (the same sensor as in the SPG) 0.25 and 0.75 m from one end, an accelerometer in the middle position (the same sensor as in the MPA), and a microphone attached to the closing lid at one end of the pipe. Some results of the measurements with the two geophone sensors of the SPS at the Obernach flume facility are discussed in Sect. 4.5.
2.2 Signal recording and processing of calibration measurements
During a calibration measurement, i.e. the time period of direct bedload sampling, the full raw signal was recorded for each measuring system (Table 2). The geophone sensor we used was designed for seismic applications and may not yield reliable measurements for frequencies larger than a few kHz. Therefore, we decided to use a measuring frequency of 10 kHz for the SPG system at all sites. Microphones and accelerometers are able to pick up higher frequencies, and therefore we decided to use a measuring frequency of initially 50 kHz for the JPM and 20 kHz for the MPA at the Erlenbach (Table 2). Due to limitations of the data acquisition systems at other sites, we used a measuring frequency of 10 kHz for the GP-Acc at the Albula and for the MPA at the Avançon de Nant stream. For the JPM and the MPA at the Erlenbach, the raw signal was down-sampled to 10 kHz before further processing for the calibration analysis to avoid any possible bias due to differences in sampling frequency when comparing the MPA measurements from the Erlenbach and the other sites.
During normal flow monitoring conditions (including the periods with direct bedload sampling), a pre-processing of the vibration signal provides summary values; due to data storage limitations, the full raw signal is not always recorded. For all four measuring systems, the following summary values were recorded for each 1 min time interval (Rickenmann et al., 2014): (i) whenever the voltage or acceleration exceeds a pre-selected threshold value Amin in the positive domain, it is counted as an impulse, and the summed impulse counts (IMP) are stored; (ii) the maximum value of the signal amplitude per 1 s interval is determined and summed over the 1 min recording interval; (iii) the root mean square of the time-varying signal is calculated for each second, then squared and summed over 1 min intervals to represent the sum of the squared amplitude values (IQA).
Table 3Channel and flow characteristics from in situ measurements made during the calibration campaigns at the three field sites and at the Obernach flume. The years of the field calibration campaigns are also indicated.
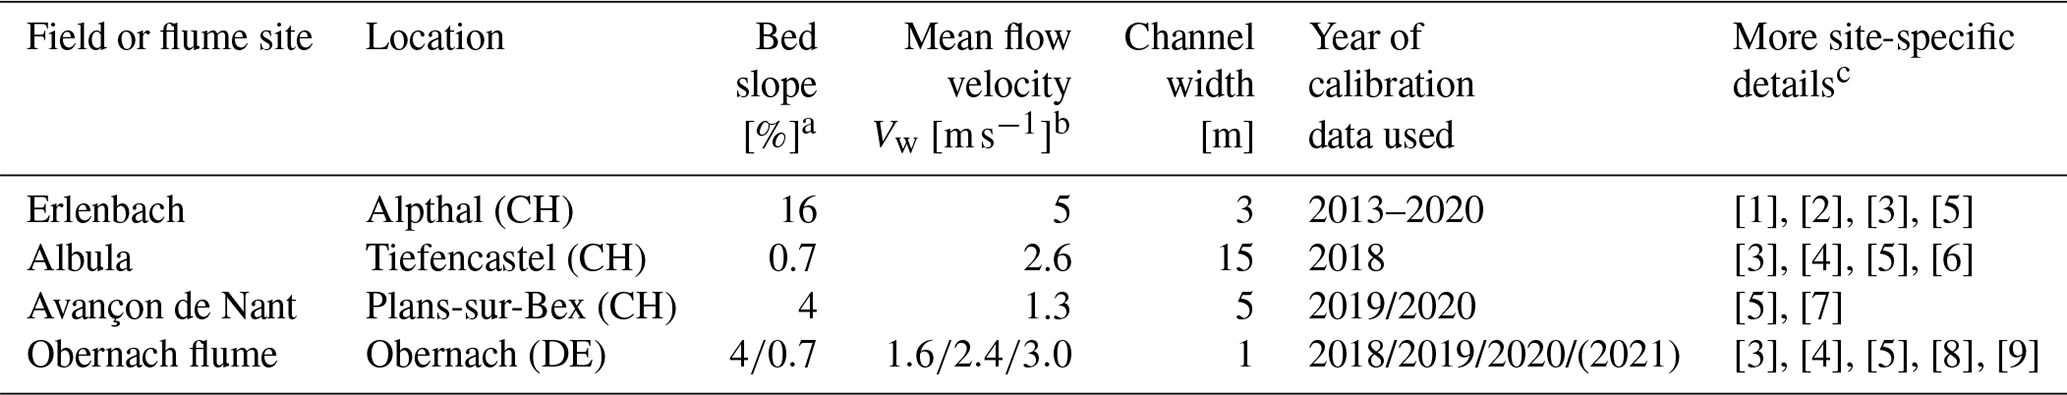
a Gradient measured upstream of the SPG plates. b Depth-averaged mean flow velocities measured during the calibration measurements at field sites; at Obernach measured 0.1 m above SPG. c [1] Rickenmann et al. (2012), [2] Wyss et al. (2016c), [3] Nicollier et al. (2021), [4] Nicollier et al. (2022a), [5] Nicollier et al. (2022b), [6] Rickenmann et al. (2020), [7] Antoniazza et al. (2022), [8] Chen et al. (2022a), [9] Chen et al. (2022b).
The threshold amplitude Amin (Table 2) was first defined for the SPG system with the aim that this value should be clearly above a mean noise level. The threshold values Amin, initially selected for the other systems, were slightly modified over time so that the registered IMP values and the selected Amin value better scaled with the SPG measurements. Previous studies with the SPG system showed that at many sites a linear calibration relation between the IMP and the bedload mass M transported over the plates provides a good description of the calibration measurements, where kb is the linear calibration coefficient (e.g. Rickenmann et al., 2012, 2014; Nicollier et al., 2021):
To check how well a linear relation approximates the calibration data, and for comparison with earlier studies with the SPG system, we also determined a power-law relation for the calibration measurements, with the empirical coefficient α and exponent β:
Using the IQA values for those minute intervals when the IMP values are zero, i.e. for time steps with no or negligible bedload transport activity, an average noise level of the signal was calculated as the square root of .
Examples of the signal output for the SPG system can be found in previous papers (Chen et al., 2022a; Nicollier et al., 2022a, b; Rickenmann et al., 2012, 2014; Wyss et al., 2016a). For the MPA measurements at the Erlenbach, the effect of down-sampling of the raw signal from 20 to 10 kHz was checked with the help of the so-called packet data (storage of the raw signal only for the time periods when a packet is detected) that were available for the years 2016 to 2020 with a time resolution of 20 kHz. It was found that maximum amplitude is practically not affected by the down-sampling (Fig. S1 in the Supplement), whereas the centroid frequency (calculated as the weighted mean of the frequencies present in the signal, determined using a Fourier transform) shows much higher values for the original 20 kHz data (in the range of about 3.5 to 8.5 kHz) than for the down-sampled 10 kHz data (in the range of about 1.0 to 3.0 kHz) (Fig. S2). This is not surprising given that frequencies can only be determined without aliasing for values lower than half the sampling frequency (Nyquist frequency; e.g. Onajite, 2014). As a result, the number of impulses is also larger for the original 20 kHz data than for the down-sampled 10 kHz data, particularly at the higher transport rates (Fig. S3). This result confirms the need for using the same sampling frequency at all sites and time periods for the purpose of our study.
Comparing the signal response between the SPG and the MPA systems per unit stream width, one has to take into account that the ratio rA of the respective plate surface areas A is , and the ratio of the number of sensors rS is (with all numbers applying for 1 m width). For an equal density of particles impacting the plate per unit surface area, and assuming a similar signal response, one could roughly expect that the MPA system should record about half as many impulses as the SPG system for a given width, e.g. over 1 m at the Erlenbach or at Obernach.
2.3 Field and flume sites with direct bedload measurements
The Swiss field sites and the Obernach outdoor flume facility were already described in some detail in other publications (e.g. Nicollier et al., 2022b; Rickenmann et al., 2012; Antoniazza et al., 2022). Therefore, only a brief overview is provided here. Table 3 summarizes the channel and flow characteristics and the year of calibration measurements. Table 4 lists the sampling method and the plate numbers of the surrogate systems used at different sites. The number of calibration measurements and the total sampled mass with the direct measurement methods at the different sites and for different measurement systems are illustrated in Fig. 3. For most sites and systems, the number of single calibration measurements was typically between about 30 and 80, and the total sampled bedload mass typically varied between about 1500 and 3000 kg.
Table 4Bedload sampling characteristics for calibration measurements at the different field and flume sites. Plate numbers are indicated by two digits. Those separated by a comma indicate that all plates recorded particle transport entering the sampler. Plate numbers on the same line experienced the same bedload transport during a given calibration measurement. Numbers are listed in orographic order from left to right (in flow direction). For the JPM, calibration measurements are only available at the Erlenbach site (“yes”). A horizontal dash (“–”) indicates that no measurements are available for a given system or set-up.
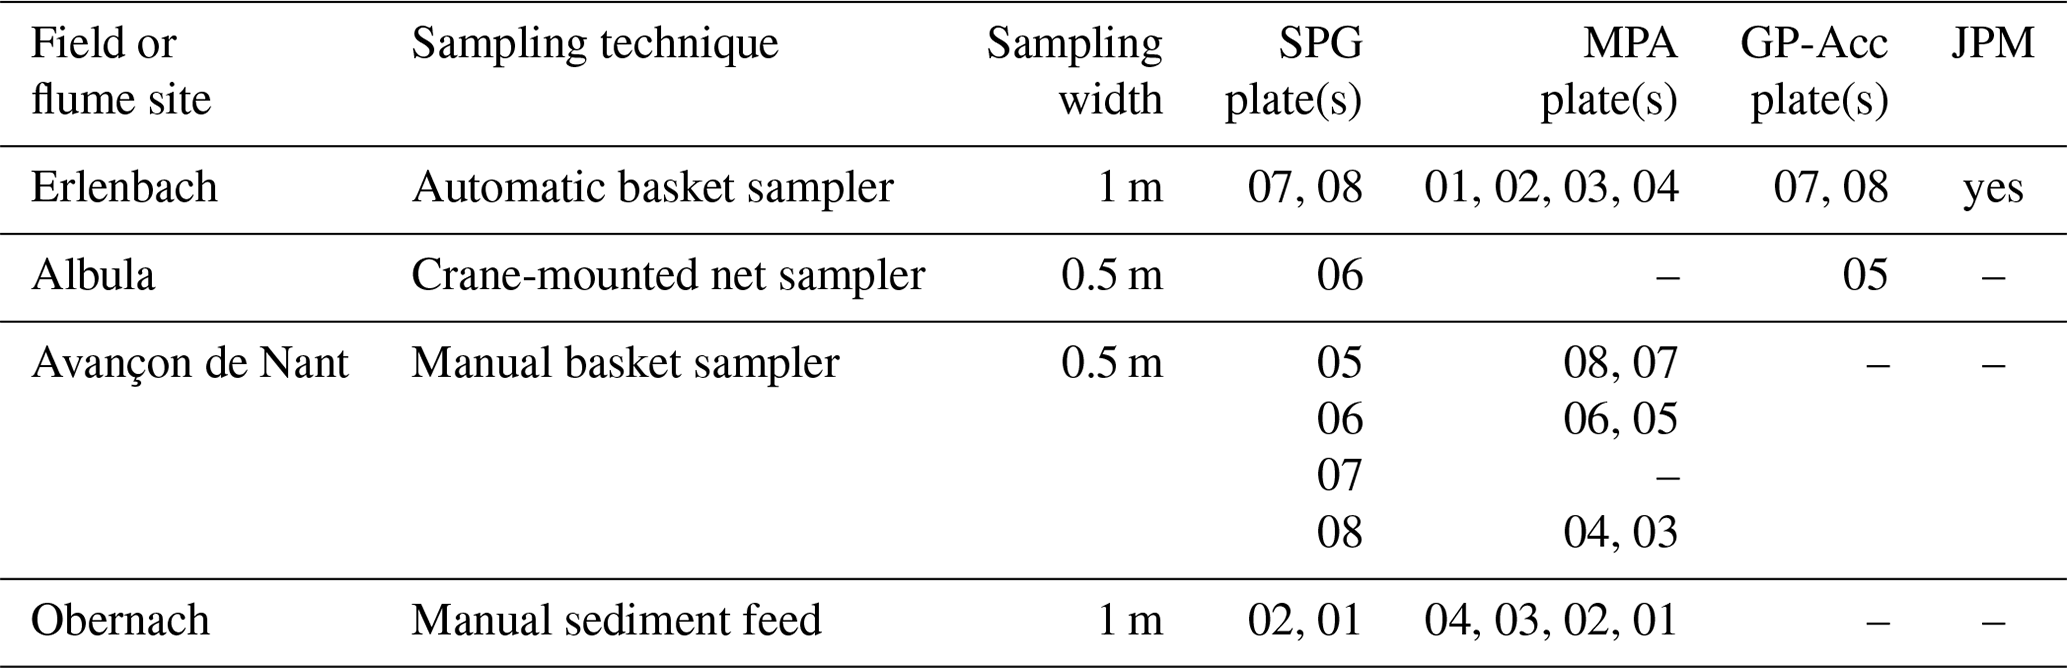
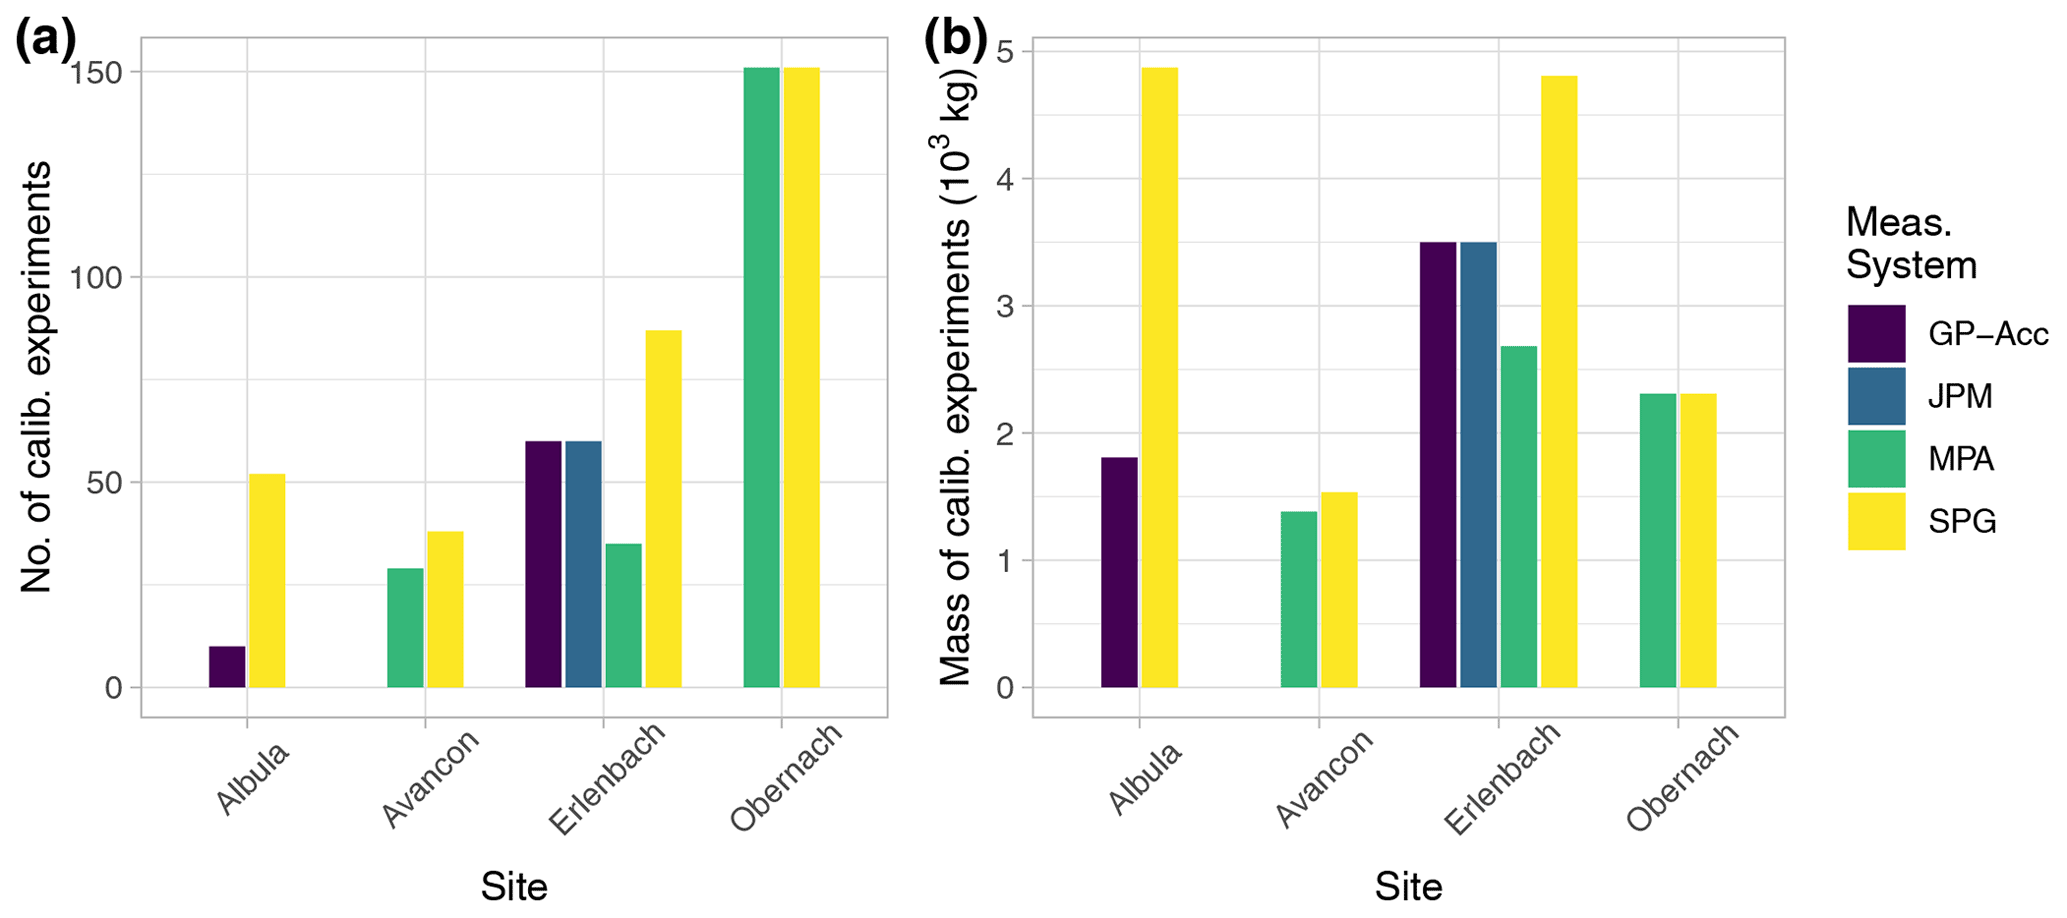
Figure 3Amount of calibration data in terms of (a) number and (b) total sampled mass with direct measurement methods at the different sites and for different measurement systems. At the Avançon de Nant, some calibration experiments included very high transport rates of fine grains (potential shield or cover effect on the plates), and those were removed for further analysis (Nicollier et al., 2022b; Antoniazza et al., 2022).
At the outdoor flume facility in Obernach, the bed slope and bed roughness of the Albula and Avançon de Nant field sites were reconstructed in a 24 m long and 1 m wide test reach (Nicollier et al., 2021). The part of the reach upstream of the surrogate measuring devices consisted of a paved section, where pebbles with a characteristic size of D67 and D84 of the surface bed material were embedded in concrete (Dxx refers to the grain size for which xx percent of the particles are finer), to provide a similar roughness to that at the field sites. In each experiment, sediment particles of known sizes were fed into the flume sufficiently far upstream of the measuring devices so that they were transported along the bed.

Figure 4Background noise level of SPG (a), MPA (b), GP-Acc (c), and JPM (d) for each year at different sites during non-transport conditions. For the field sites, the noise levels (amplitudes) were derived from the IQA values. For the Obernach site, the noise levels were determined as the median absolute amplitudes of the raw signal of each experiment. The dashed and solid lines indicate the threshold for impulse counts (Amin) and the upper limit of the output range, respectively.
3.1 Noise level during non-transport periods
The variability in the noise level for each year is illustrated in Fig. 4 for the four measuring systems and at all four measuring sites. For the SPG and MPA systems at all sites and for the GP-Acc at the Albula river, the noise level remains fairly constant over the (maximum) 7 years of observations, and most of the time the noise level is clearly below the threshold level Amin for impulse counts. However, at the Erlenbach site, a clear increase in noise level is observed for the GP-Acc and the JPM starting in the year 2016 (Fig. 4c and d). Particularly for the JPM system, the noise level often exceeded the threshold level Amin during this more recent period, thus also biassing the impulse counts for this system. The reason for this increase in noise level is likely due to a change in the data acquisition system for the GP-Acc and the JPM at the Erlenbach in June 2016 (Fig. S4). Prior to this date, the signal was recorded by a PCI (Peripheral Component Interconnect) data acquisition card embedded in the computer, whereas after this date the same signal was recorded via Ethernet cable and separate acquisition modules. This temporal instability of the noise level has to be accounted for when assessing the calibration relationships for different time periods. At the Albula site, an unstable behaviour of some of the accelerometer sensors (GP-Acc) was very pronounced; the signal of these sensors was hardly usable at all, and these sensors had to be disconnected from the recording system.
3.2 Calibration relationships for different systems and sites
We first compare the calibration of different measuring systems for the Erlenbach site because it is the site with the largest number of systems and the longest observation periods (Fig. 5, Table 2). While the number of impulses per bedload mass kb is relatively stable and stays constant over time for the SPG system, we see an increased variability for the other measurement systems (Fig. 5a). The GP-Acc and the JPM systems also show a good performance for the period before June 2016, but for the later period the calibration data show a much-increased scatter around the mean calibration relation based on observations before June 2016 (Fig. 5b).
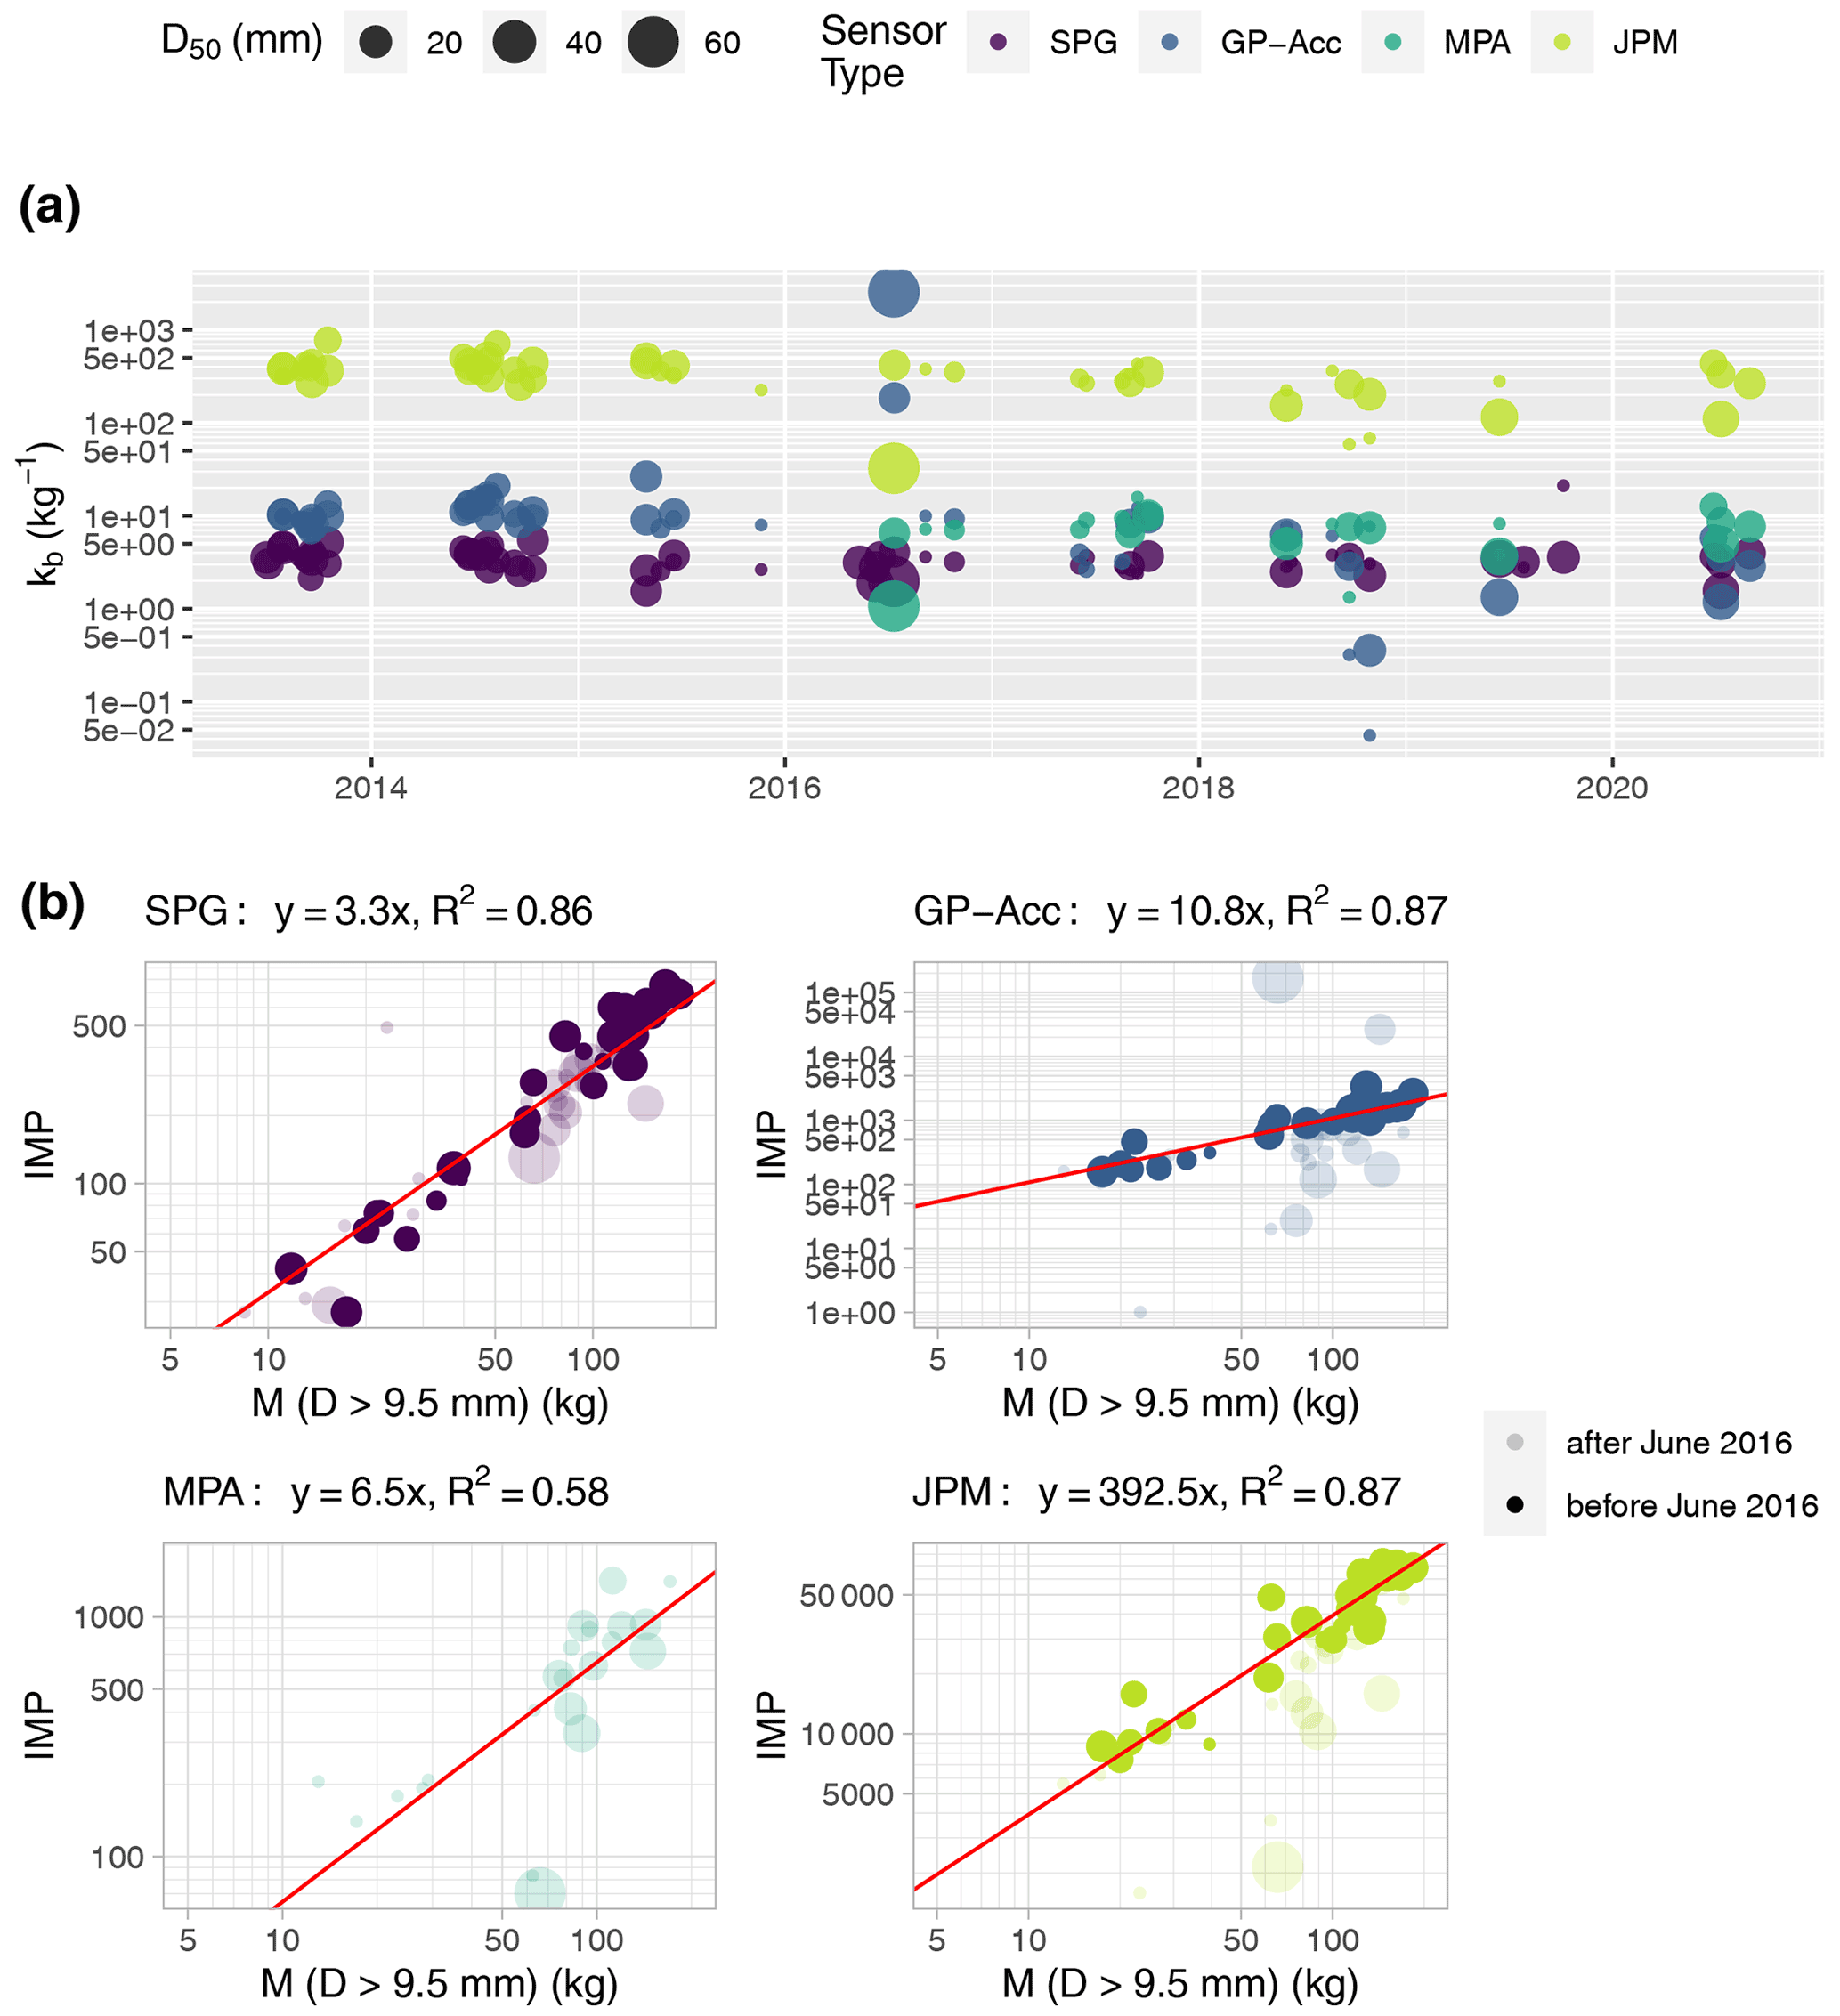
Figure 5Calibration measurements at the Erlenbach. (a) Temporal evolution of ratio of impulses per transported mass kb. (b) Calibration relation for each measurement system, showing the IMP vs. bedload mass M. Samples lighter than 5 kg were excluded, and only grains with D>9.5 mm were retained from the direct samples. In June 2016, the data acquisition system recording the signal of the GP-Acc and the JPM systems was changed; the same acquisition system was used to record the MPA measurements (starting in 2016). For the GP-Acc and the JPM, regression equations refer only to the period before June 2016. The SPG measurements were recorded by a different system, which did not change in the period 2013 to 2020.
We now compare the calibration relations for the SPG and MPA systems at the Erlenbach site, the Avançon de Nant site, and the Obernach flume to consider also the between-site variability. For the SPG system, we find fairly good linear calibration relationships for all three sites, the squared correlation coefficient values R2 varying between 0.78 and 0.86 (Fig. 6a). Similar calibration relations were reported by Nicollier et al. (2021, 2022b) in terms of IMP or signal “packet” counts vs. unit bedload transport rate. A packet is defined as a continuous time section of the SPG signal corresponding to one impact of a bedload particle. For the MPA system, we find weaker linear calibration relationships for the Erlenbach and Avançon de Nant sites, with R2 values of 0.54 and 0.58, while at the Obernach site there is only a very poor correlation between IMP and M (Fig. 6b). The smallest R2 value obtained for this site may be partly due to preferential particle trajectories (along the sidewalls) caused by the fixed rough bed upstream and due to the smaller total impact surface of the MPA as compared to the SPG.
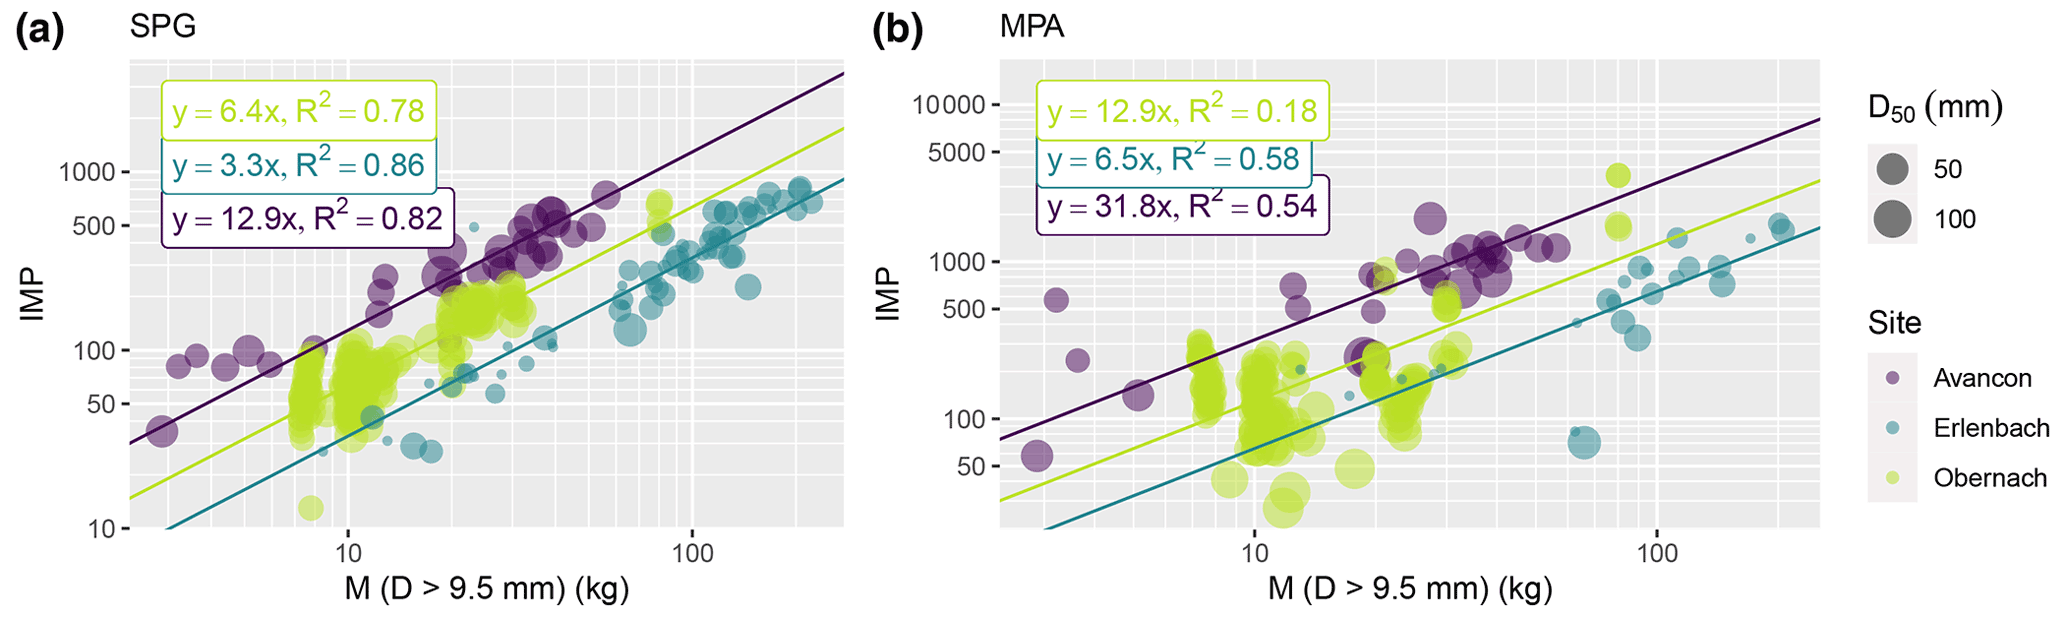
Figure 6IMP vs. total transported mass M (D>9.5 mm) for the calibration measurements at different sites. Samples lighter than 5 kg were excluded for the calculation of the regression for the Avançon de Nant. Results in panel (a) are for the SPG, and results in panel (b) are for the MPA.
For a given bedload mass M, the number of impulses increases for both the SPG and MPA from the Erlenbach site to the Obernach flume to the Avançon de Nant site (Fig. 6), which is reflected in an increasing linear calibration coefficient kb. We have evidence for the SPG system that this increase in signal response is due to a decrease in mean flow velocity (Erlenbach > Obernach > Avançon de Nant) and due to a smoother channel roughness at the Erlenbach compared to Obernach and Avançon de Nant (Nicollier et al., 2022). These two factors both influence the transport mode of the bedload particles and the signal response of the systems (Chen et al., 2022b). We suspect that an increase in flow velocity and a decrease in bed roughness will similarly result in a reduced signal response for the MPA system.
Table 5Linear and power-law calibration relationships between IMP and M (D>9.5 mm) obtained for the different sites and the different measuring systems. N is the number of samples used for the regression calculation. * Determined for the period before June 2016.
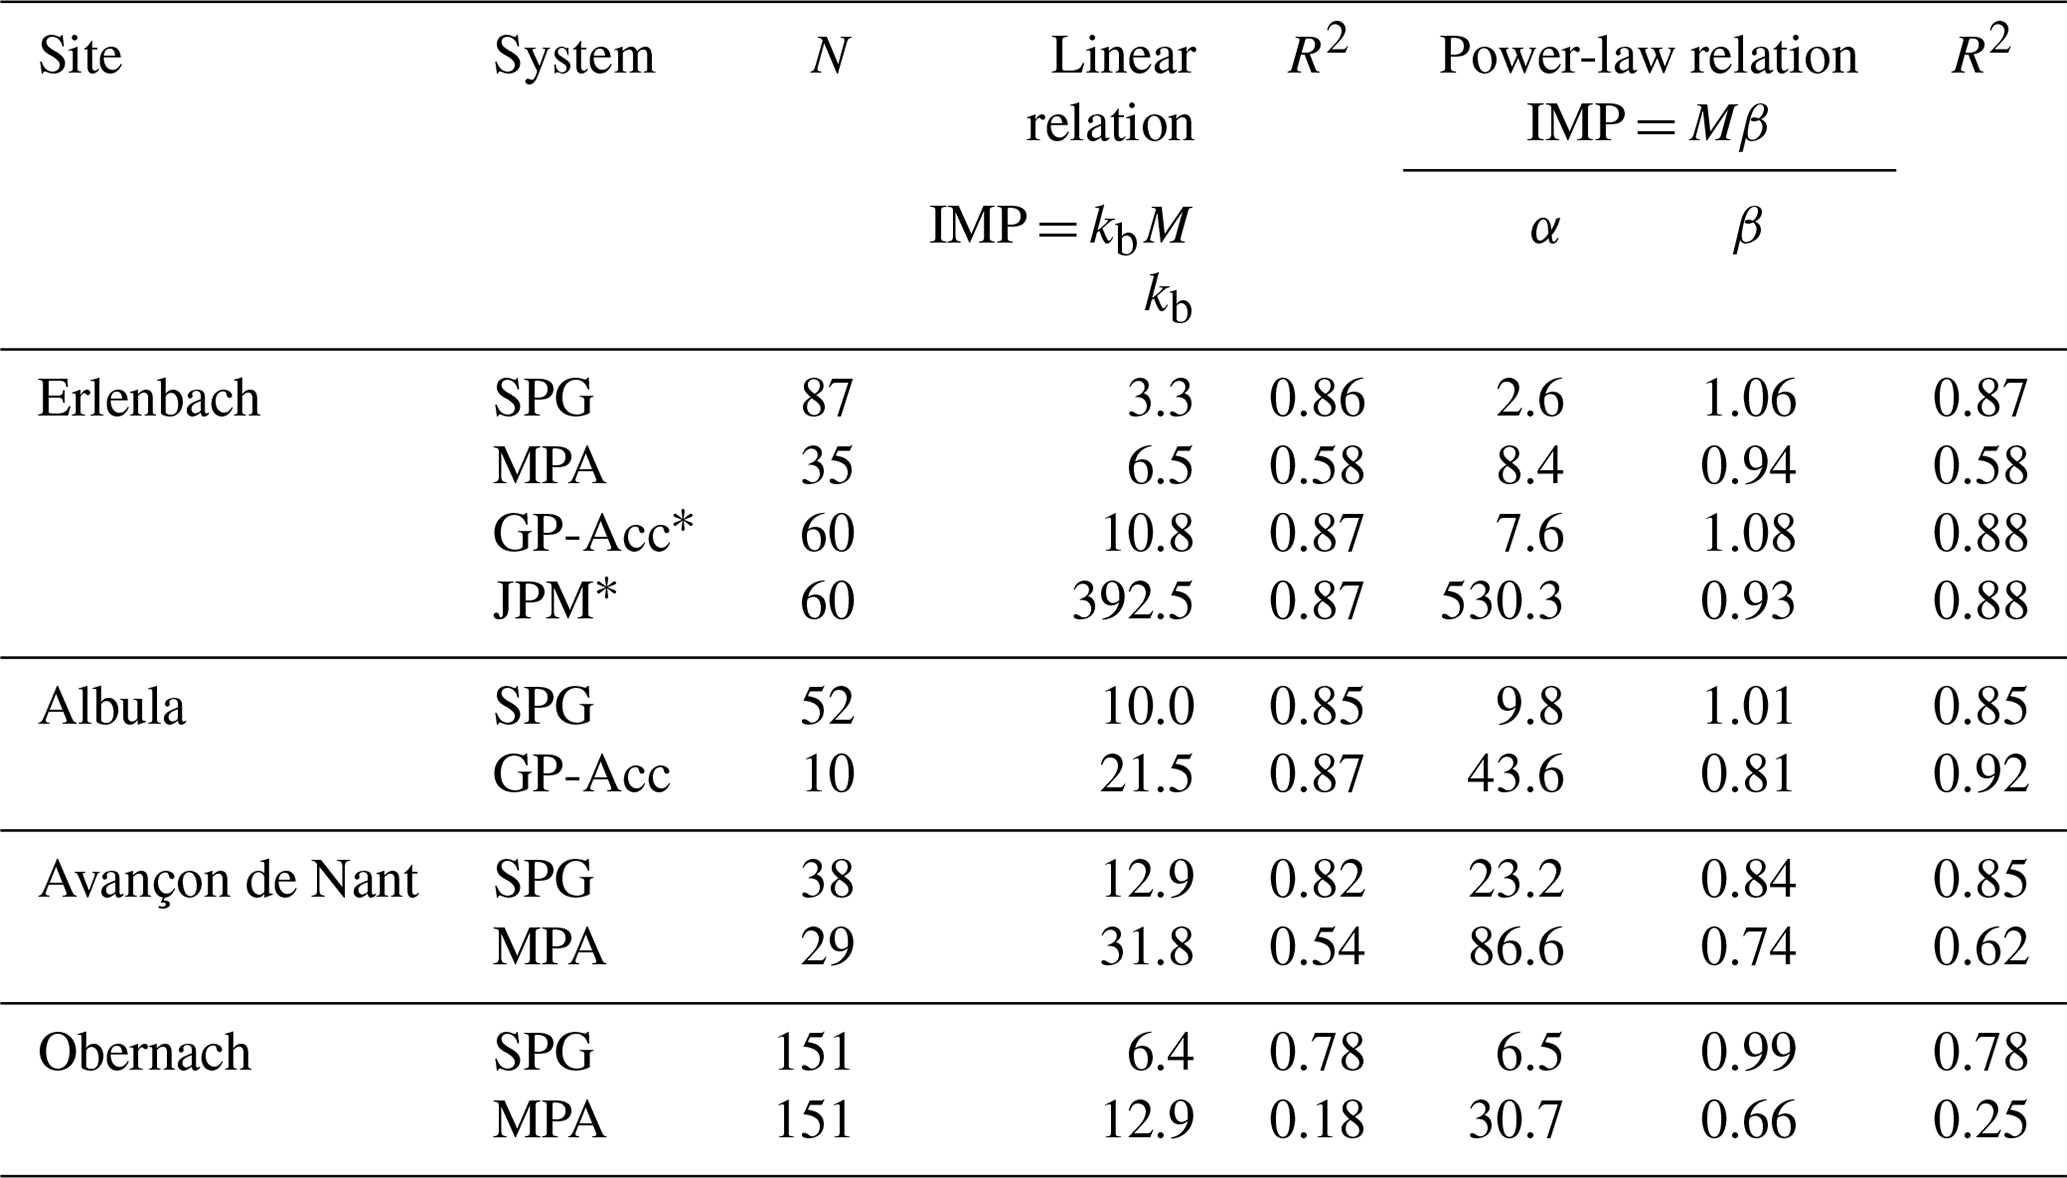
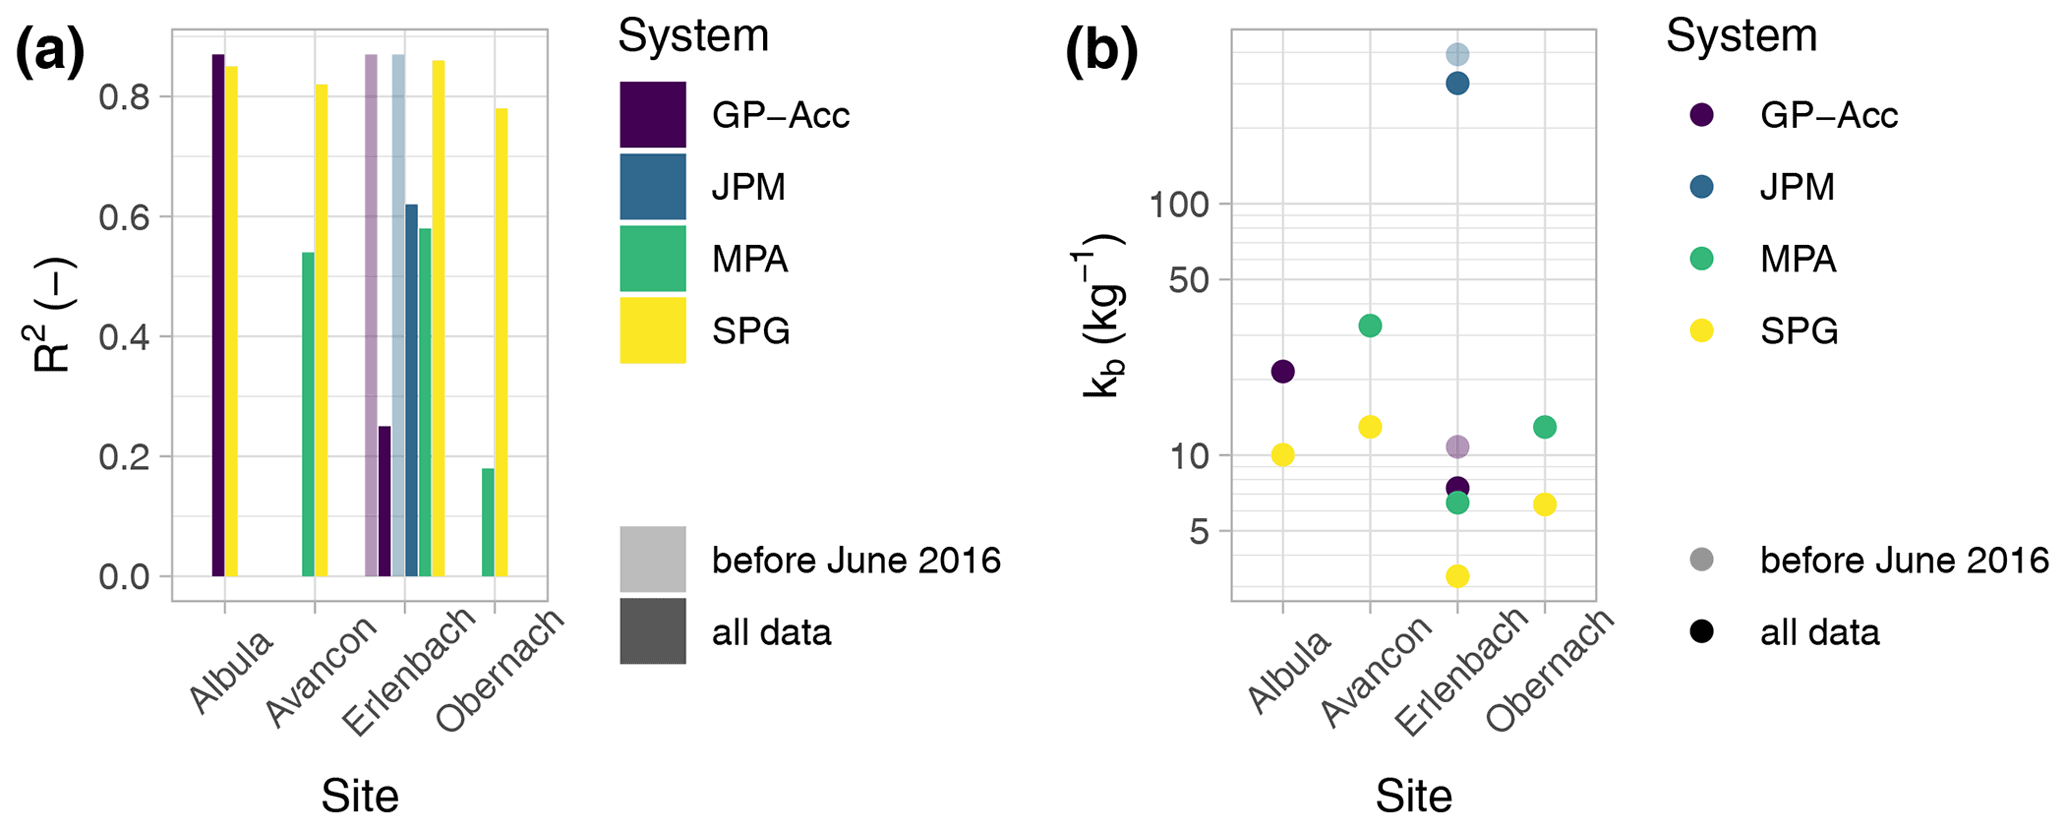
Figure 7Overview of calibration relations for different measurement systems at different sites. (a) Correlation coefficient R2 for the linear regression, (b) linear calibration coefficient kb.
A comparison of the calibration relationships (in linear and power-law forms) obtained for the different sites and the different measuring systems is compiled in Table 5 and illustrated in Fig. 7. The correlation coefficients R are mostly quite similar for the linear and the power-law relations, indicating that a linear calibration relation can provide a good description of the measurements if the power-law exponent β is close to one, and R is fairly large, as is true for many cases in Table 5. For all four sites (for the Erlenbach only for periods with a stable noise level of the signal), good correlations with R2 values > 0.77 were obtained for the SPG, GP-Acc, and JPM systems (Fig. 7a). For the MPA system, R2 values are moderately good at the Avançon de Nant and Erlenbach sites (0.54 and 0.58, respectively) but very poor (0.18) at the Obernach site (Fig. 7a). Concerning the inter-site variability in terms of the kb values, the relative differences appear to be similar at different sites when comparing both GP-Acc with SPG and MPA with SPG (Fig. 7b).
Comparing the performance of the MPA and SPG only, a generally lower quality of the calibration relations is observed at all sites for the MPA (Figs. 5–7, Table 5). This could be due in part to generally weaker signal responses of the MPA system triggered by larger particle impacts. This is evidenced from the observations at the Obernach flume site, for which IMP values as a function of M are plotted separately for different grain size classes in Fig. 8. For total bedload masses M in the range 4 kg < M < 50 kg, there is a variability in the signal response of up to about a factor of 10 for the SPG system, without a clear correlation with grain size class. This variability is reflected by the position of each data point relative to a linear mean trend line in a figure of IMP values vs. bedload mass M, and it can be quantified by kb,i values with subscript i for an individual measurement, defined as the ratio of the number of registered impulses to the bedload mass of a given sample. In contrast, for the MPA system the variability in the signal response is more than a factor of 10, with larger particles clearly generating fewer impulses for a given bedload mass. The comparison in Fig. 8 also shows that the MPA is more sensitive to smaller grains (ca. 20–50 mm), whereas the SPG is more sensitive to larger grains (ca. 50–100 mm). Given the greater proportion of smaller grains as compared to bigger ones in natural streams, it may explain the generally larger kb values for the MPA than for the SPG at a given site (Table 5).
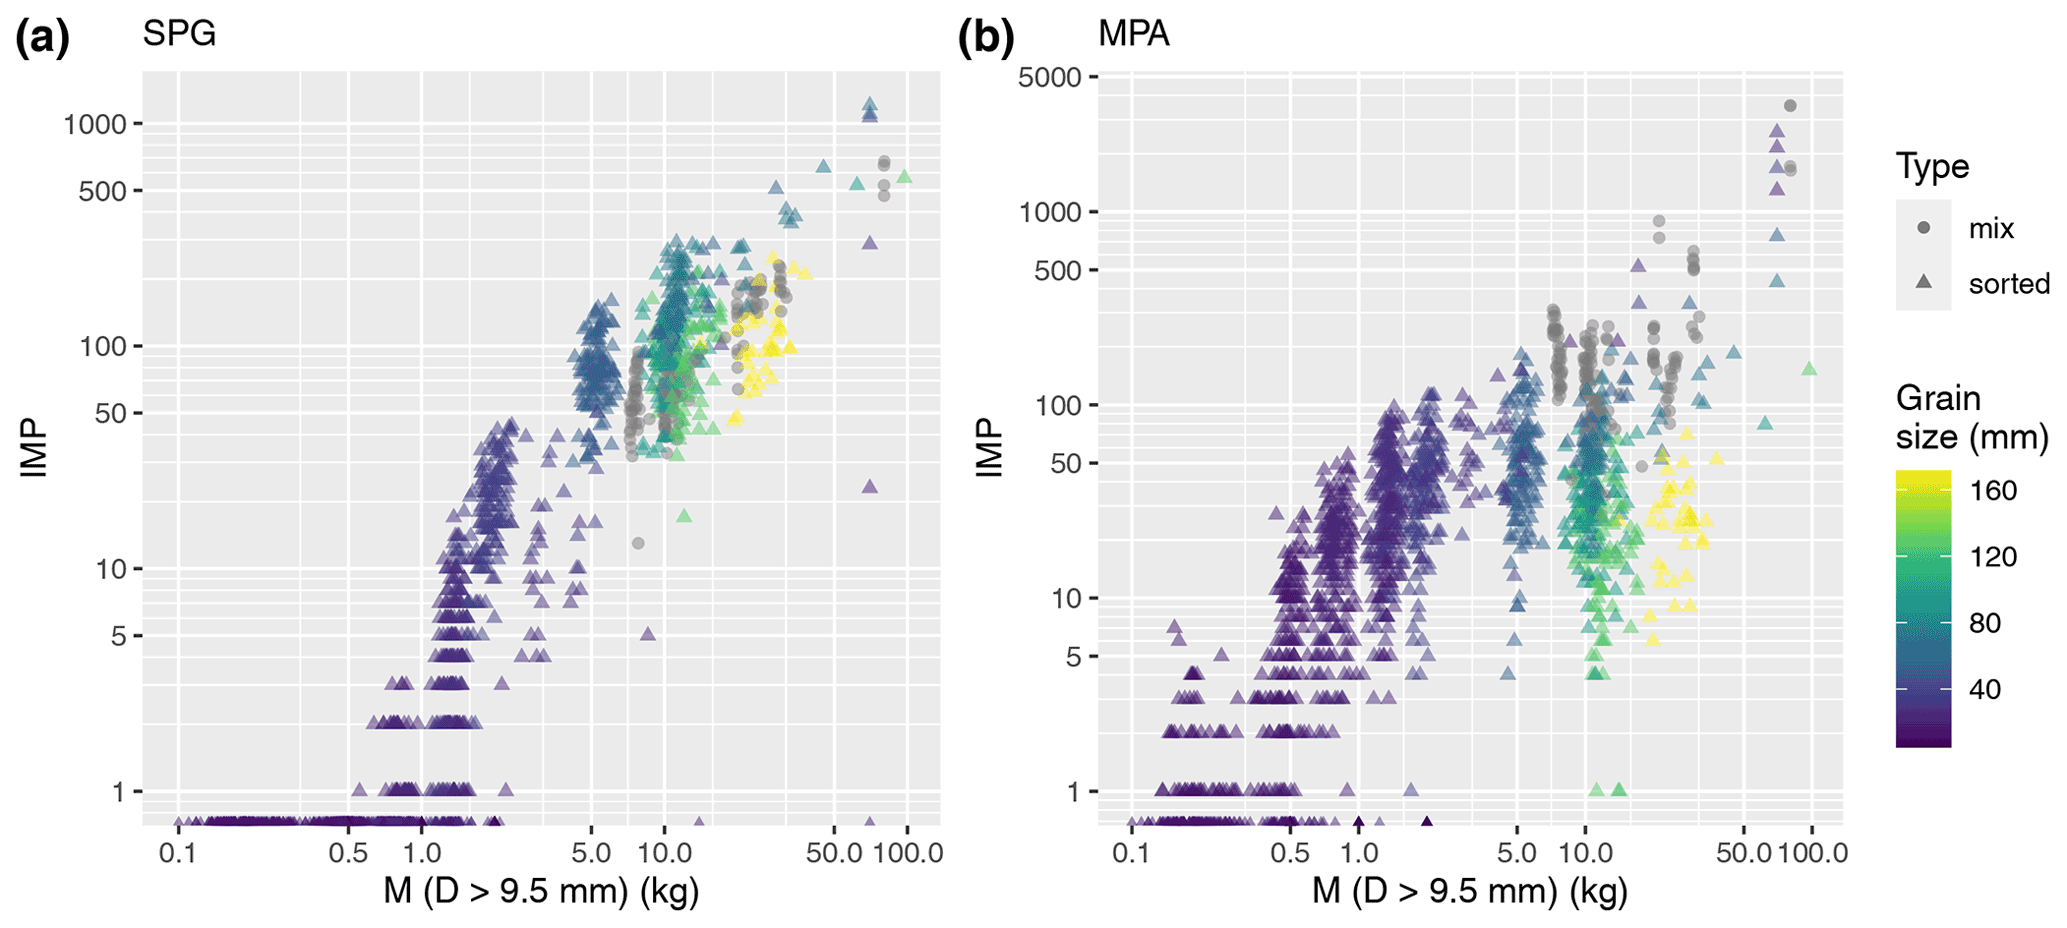
Figure 8Obernach flume site. (a) SPG impulses and (b) MPA impulses vs. total transported mass M, for both flume experiments with single grain size classes (“sorted”) and those with mixed grain sizes (“mix”). The size class indicates the median grain size present in each experiment.
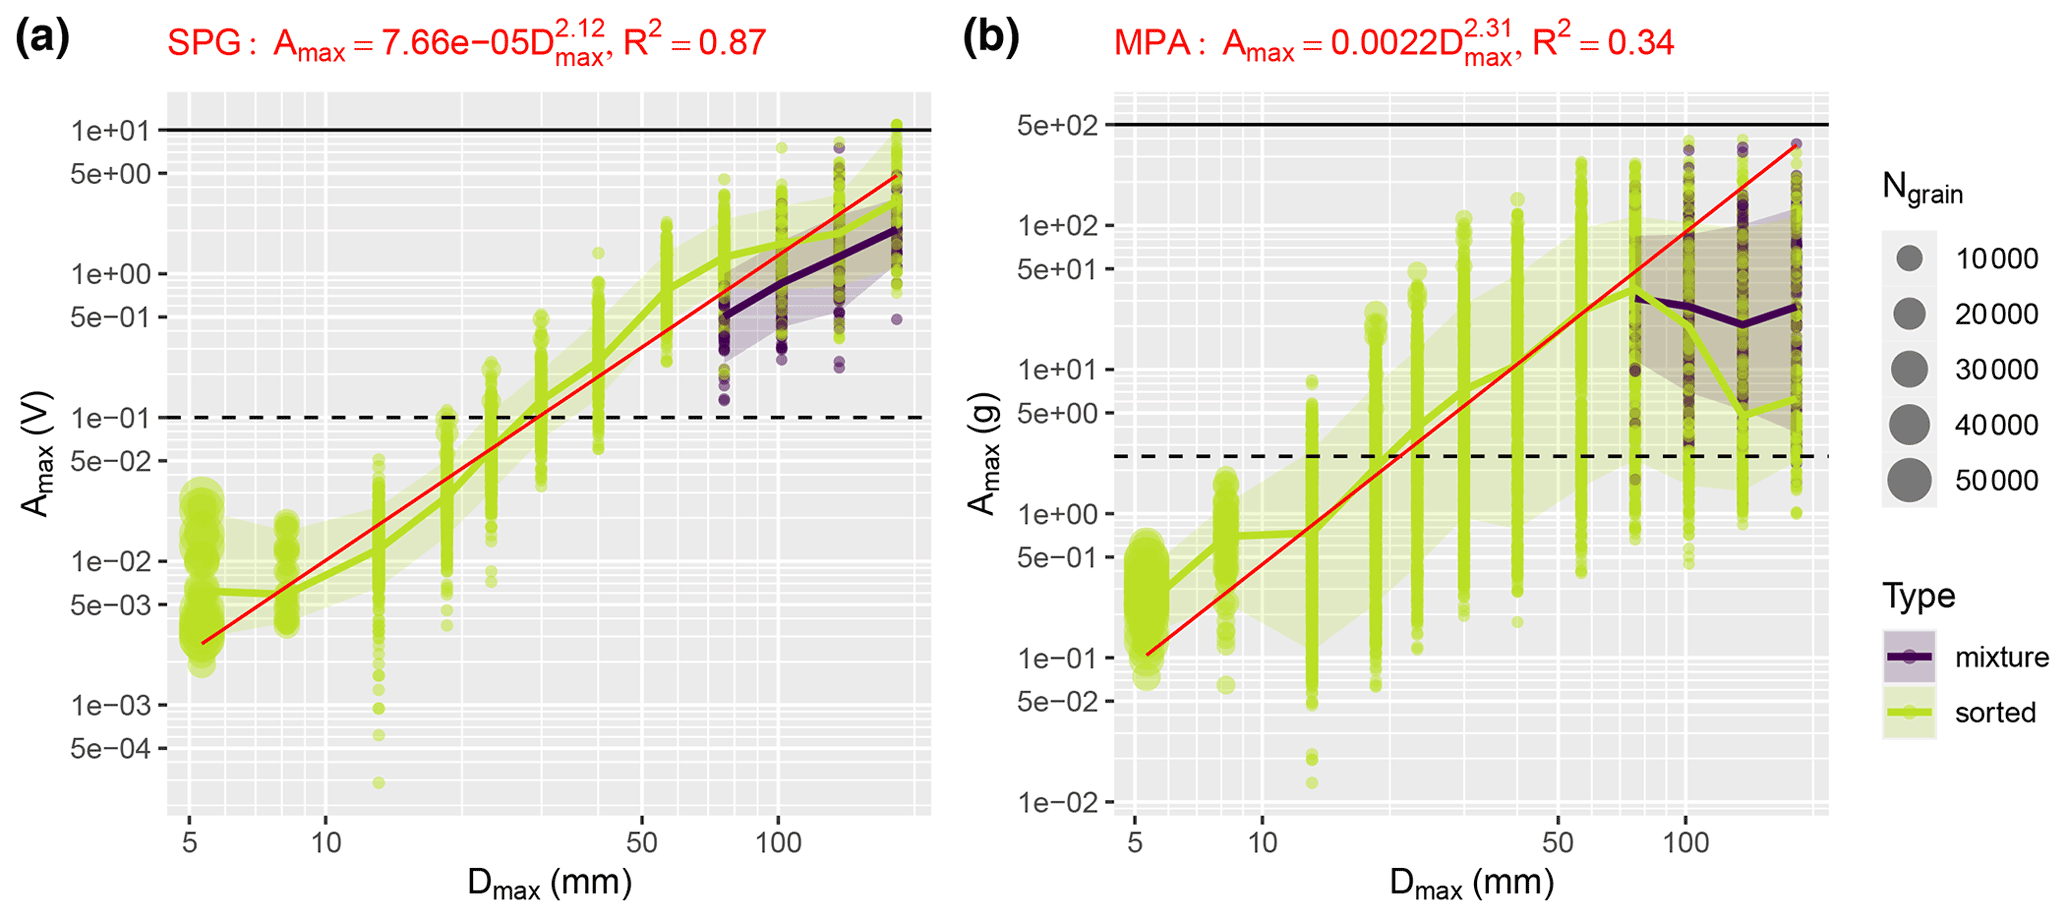
Figure 9Obernach flume site. Maximum (positive) amplitude Amax recorded per experimental run vs. grain size D. The power-law regressions are based on the sorted (single grain size class) experiments only. (a) For the SPG system, (b) for the MPA system.
4.1 Amplitude and frequency response to particle impact for the SPG and MPA systems
The generally weaker signal response of the MPA system to the impact of larger particles as compared to the SPG system (Fig. 8) is likely due to two factors observed for the Obernach flume experiments. First, there is generally a larger (relative) variability in the maximum amplitude response over all the experiments for a given grain size class for the MPA system (Fig. 9). Second, the tendency for increasing maximum amplitude with increasing grain size is only observed for D up to about 76 mm for the MPA system, whereas for larger particles the mean maximum amplitude even decreases (for the sorted experiments) or remains approximately constant (for mixture experiments) (Fig. 9). Two hypotheses may be raised to explain this behaviour: first, the metal plate (box) of the MPA system is embedded in several layers of elastomer, representing a much larger volumetric proportion of elastomer vs. steel. As such, the metal plate is mounted in a softer, more deformable environment with higher absorption capacity than for the configuration of the SPG system. Second, the ratio rA of the total plate surface area of the MPA to that of the SPG per 1 m channel width is about 0.26 (Sect. 2.2), resulting in a greater probability for the MPA system that large particles (that were limited in number) impacted onto the area between the plates or on the edges of the plates than was the case for the SPG system. (In fact, the number of particles per experimental run decreased towards larger grain sizes.) In contrast to the differing amplitude response of the two systems, the centroid frequency response for changing grain sizes was rather similar for the MPA and the SPG system (Fig. 10). For both systems, the gradient of decreasing frequency is somewhat steeper in the larger-particle data domain and weaker in the smaller-particle domain.
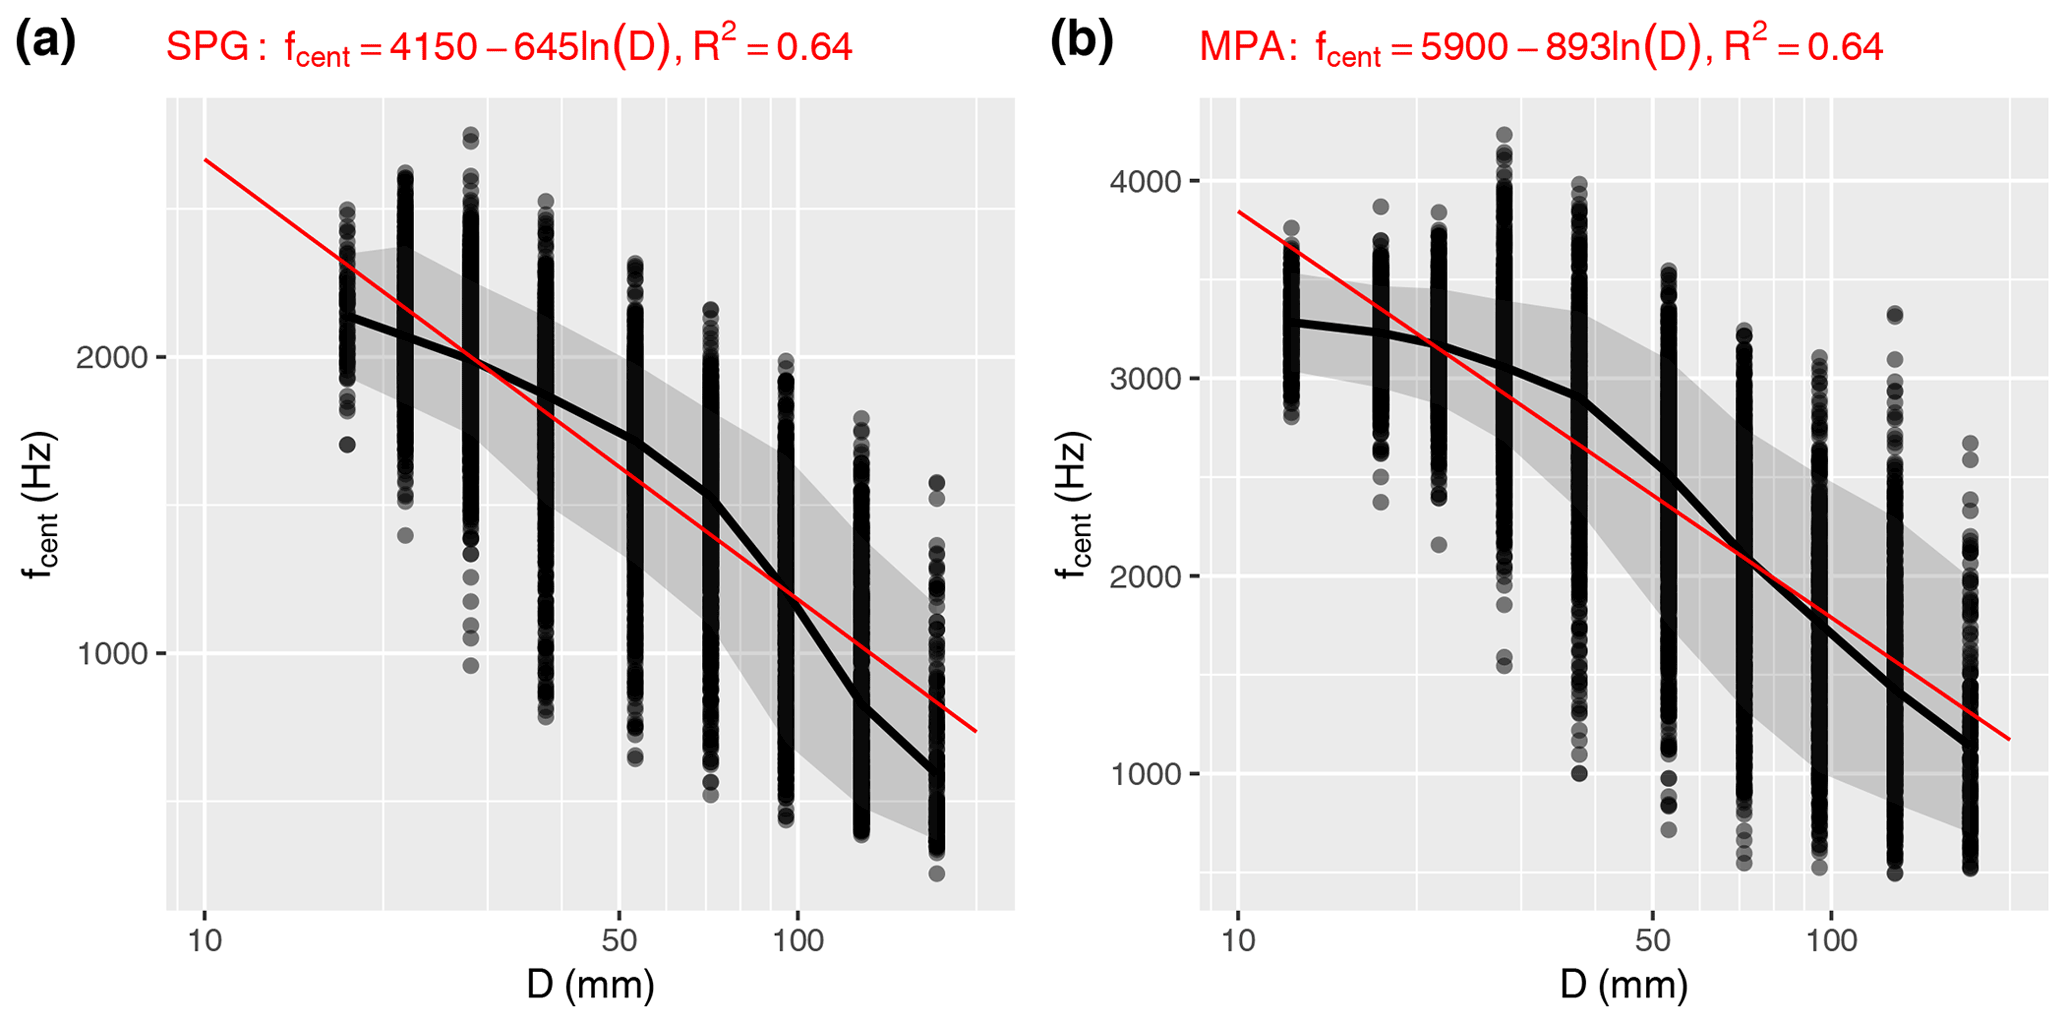
Figure 10Obernach flume site. Centroid frequency fcent vs. grain size D for packets with the five largest amplitudes per experimental run vs. grain size D. Only single grain size class experiments were used. (a) For the SPG system, (b) for the MPA system.
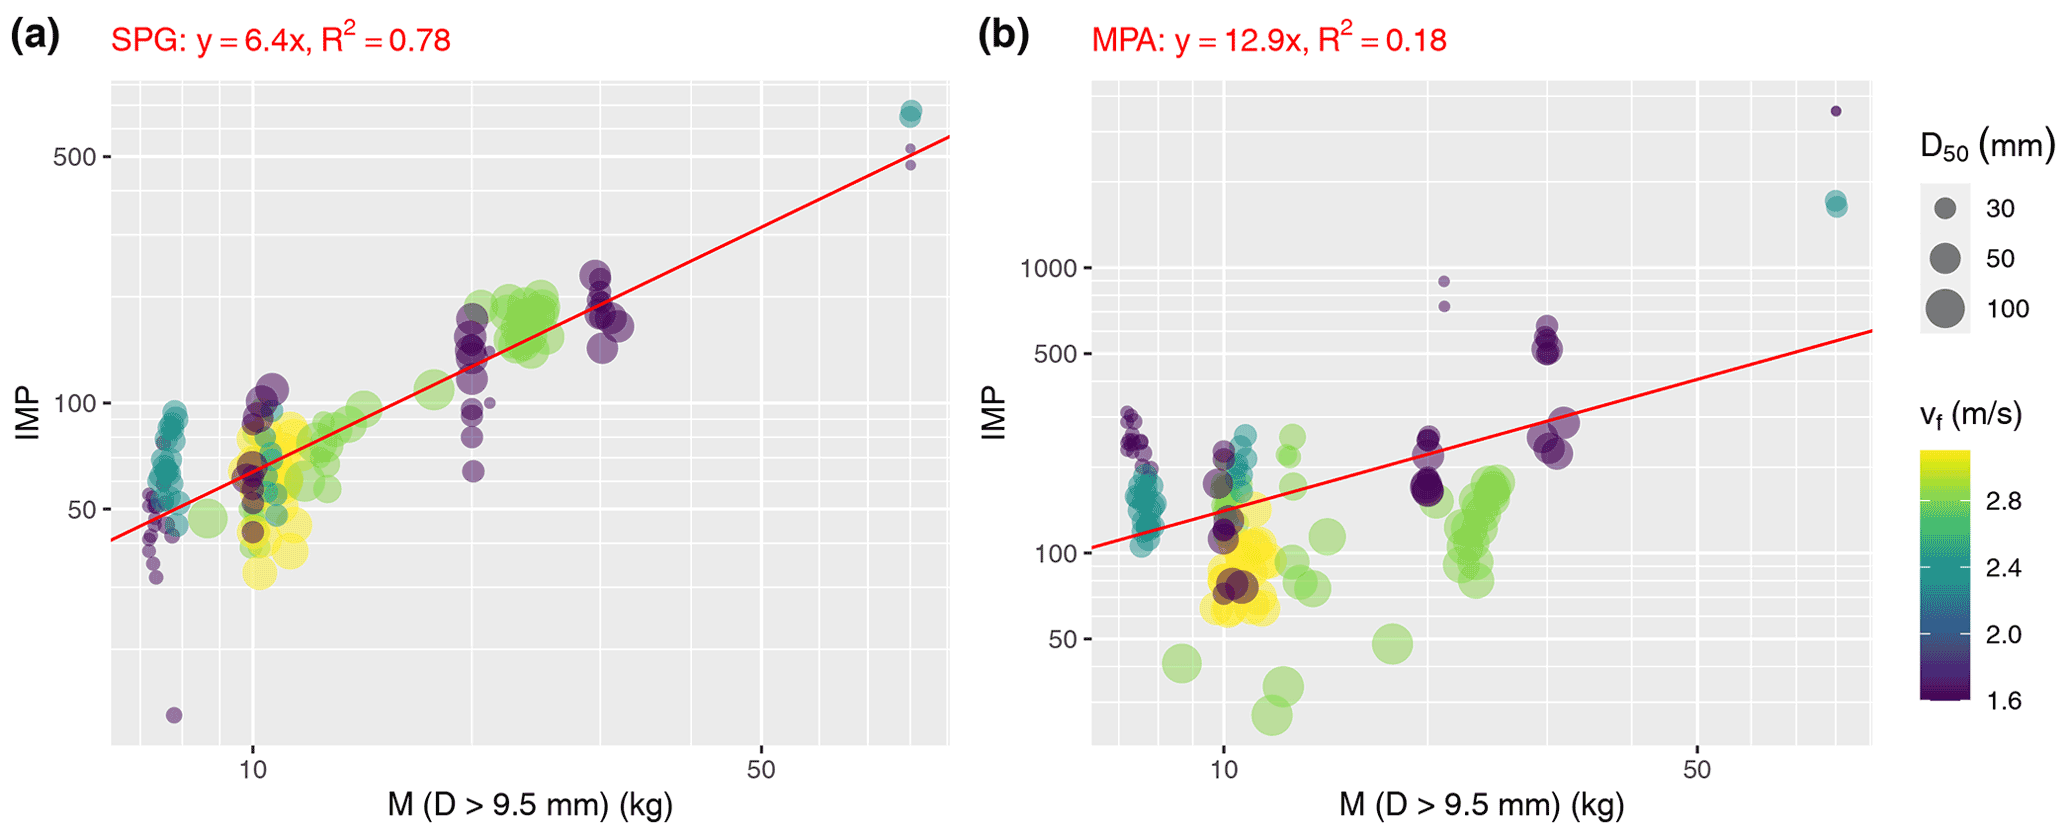
Figure 11Obernach flume site. Signal IMP vs. total transported mass M for flume experiments with bedload material of mixed grain sizes; m50 is the median total particle mass, and vf is the water velocity 10 cm above the impact plates. (a) For the SPG system, (b) for the MPA system.
4.2 Velocity effect on signal response of the SPG and MPA systems
The effect of changing flow velocities (and thus particle velocities or transport mode) was investigated with the calibration measurements from the Obernach flume site, showing that different flow velocities resulted in a larger scatter around a mean calibration line for the MPA system than for the SPG system (Fig. 11). Considering the velocity effect on the amplitude response of the two systems, we observed that the variability in the amplitude for a given grain size (class) is clearly larger for the MPA than for the SPG system (Fig. 12). The maximum amplitude of a signal packet correlates with the number of recorded impulses, which may be partly responsible for the larger scatter of the data around a mean calibration relation (as in Fig. 11) and the generally more weakly associated correlation coefficient for the MPA as compared to the SPG system (Table 5). Regarding the effect of flow velocity on the centroid frequency, its variability was similar for both systems for D>40 mm, whereas for D<40 mm a changing flow velocity leads to a more variable centroid frequency for the SPG than for the MPA system (Fig. S5). If frequency information was used for grain size classification, the MPA system (or using accelerometer sensors in general) would have a potential advantage to better classify smaller particles compared to the SPG system (or using geophone sensors).

Figure 12Obernach flume site. Maximum grain size Dmax vs. maximum (positive) amplitude Amax for the sorted grain size experiments; vf is the water velocity 10 cm above the impact plates. (a) For the SPG system, (b) for the MPA system. Amax represents the largest amplitude of the two geophone sensors (a) or of the four accelerometer sensors (b). Dmax represents a value 20 % larger than the characteristic diameter of a given grain size class. The dashed vertical line indicates the threshold value for the impulse counts, and the solid vertical line indicates the nominal maximum value that can be recorded by the measuring system.
4.3 Noise level and signal “saturation” for frequent particle impacts
We found that the noise level of the Erlenbach systems with accelerometers (GP-Acc) and with microphones (JPM) was probably affected by a new set-up of the electronic measuring and recording system in June 2016 (Figs. 5 and S4). Both systems showed a higher noise level and a larger variability after the installation of the new measuring and recording equipment. Interestingly, the noise level of the MPA system (that was put in operation in June 2016 at the Erlenbach) was similar to that of the GP-Acc system before June 2016. These observations indicate that care must be taken when using sensors that require a constant power supply to be in recording mode, as opposed to a geophone sensor, which is a passive system and where a current is induced directly by a particle impact.
We have also noted that the accelerometer sensors used in the MPA system are sensitive to changing temperature. This is visible from daily and roughly parallel fluctuations in both the temperature and noise level at the Avançon de Nant site (Fig. S6b and c) and from similar daily fluctuations in the noise level at the Erlenbach site (Fig. S6a). Furthermore, the signal of IEPE accelerometer sensors is known to be sensitive to shock impacts (Levinzon, 2015). This is illustrated in Fig. S7, which shows a temporary saturation of the signal lasting about 2 s, for the case of the GP-Acc system at the Erlenbach site. As a precaution, when analysing the raw signal of the GP-Acc and MPA systems, we pre-processed it with a high-pass filter with a threshold of 50 Hz, which partially removes the saturation effect.
A different kind of saturation may occur if the transport rates are very high or if the signal packet after a single particle impact is of rather long duration, which leads to an overlap between the two individual packets. For the JPM, the typical duration of one packet (also called “pulse” in publications by Japanese authors) is of the order of 50 to 100 ms (Mizuyama et al., 2010a; Koshiba and Sumi, 2018; Choi et al., 2020). For the SPG system, in contrast, the typical duration of one packet is about 2 to 20 ms. At the Erlenbach site, the relative time occupied by packets amounted to a few percent of the total recording time during bedload sampling, even at the highest bedload transport rates qb (∼1–3 kg m−1 s−1) (Wyss et al., 2016a). Saturation due to frequent particle impacts may be expected for the SPG only for qb larger than 10 kg m−1 s−1. However, saturation due to frequent particle impacts may be expected for the JPM at qb values larger than about 0.1 kg m−1 s−1 (Mizuyama et al., 2010a).
For the MPA measurements at the Obernach flume site, we designed an algorithm for automatic detection of saturation events, which is based on the number of times the amplitude crosses the 0 line. We found that signal saturation events on MPAs were caused by particles with b-axis diameter larger than ca. 70 mm (Fig. S8a). However, the number of experiments with signal saturation is small compared to the non-saturating ones. This lets us conclude that signal saturation is not a severe constraint and occurs only for maximal amplitudes that are close to the boundary of the output range (Fig. S8). This was confirmed with drop experiments using quartz spheres falling on the MPA at the Avançon de Nant. Only close to the upper limit of the accelerometer output range (500 g) were signal-saturating impacts observed.
4.4 Transport intensity, lateral signal propagation, and further observations
Previous studies with the SPG system (e.g. Wyss et al., 2016a; Chen et al., 2022a, b; Nicollier et al., 2022b) indicated that the number and size of registered impulses primarily depend on (i) the impact location on the plate, (ii) the particle impact velocity or the energy of the particle impact transmitted to the plate, (iii) the particle shape and the mode of transport, and (iv) the number of particle impacts for a given size. Assuming that the geophone sensor reacts symmetrically to its centre and that a bedload particle is equally likely to impact at each point over the plate, one would expect a mean number of registered impulses for a given particle, and also the other factors contributing to the variability in the signal response would be more and more averaged out over an increasing number of transported particles. Thus, it is not surprising that the variability in the signal response for a given bedload mass or transport rate decreases with increasing mass (Rickenmann et al., 2014) or increasing transport intensity (Rickenmann and Fritschi, 2017), respectively. Similarly, we can expect that the variability of the signal response between two different impact systems will be reduced for increasing transport intensity. This is documented by our continuous recording of IMP values with a 1 min time resolution for the example of the Erlenbach site, for which we compared GP-Acc and SPG measurements (Fig. S9) as well as measurements of two neighbouring MPA plates (Fig. S10) for different transport intensities. The latter example (Fig. S10) also documents a temporal shift in the relation between IMP (MPA04) and IMP (MPA03), which is also visible in the change in the mean signal response (i.e. the kb value) over time for the calibration measurements shown in Fig. 5. Similarly, higher transport intensities result in a stronger correlation of IMP values per minute, as is illustrated for the Erlenbach site when comparing IMP (MPA01–04) with IMP (SPG07–08) (Fig. S11), IMP (JPM) with IMP (MPA01–04), and IMP (JPM) with IMP (SPG07–08) (Fig. S12).
For the SPG system, we had identified an important factor contributing to the inter-site variability in the mean signal response, which is both the lateral signal propagation across the steel frame structure and the longitudinal signal propagation from concrete to the SPG array. The magnitude of the signal propagation increases with particle size or impact energy (Antoniazza et al., 2020; Nicollier et al., 2022a, b). Given that the construction of the MPA system involves relatively more elastomer material than in the case of the SPG system, we could expect that the signal propagation is of less importance for the MPA system. To study the signal propagation for the MPA, we applied a modified analysis combining all four accelerometers of an array of 1 m width (such an array is present at the Erlenbach and Obernach sites, and two such arrays were installed at the Avançon de Nant site) to obtain a four-dimensional signal that evolves in time. More specifically, a time window is started when the envelope of the signal of one of the sensors exceeds the threshold level, and the time window is ended when all of the envelopes have dropped below the threshold level again. Within each time window, we then compared the two maxima of the sensors that have the highest and the second-highest amplitude to obtain an indication of the degree of signal attenuation in the lateral direction. For that, we took the ratio of the two maxima. For most time windows at the Avançon de Nant site (as an example), the attenuation factor was around 30, and it tended to only slightly increase for larger particle impacts (Fig. S13). Thus, the attenuation of the signal is larger for the MPA than for the SPG system.
A preliminary comparison of the signal of the JPM and the SPG and of the GP-Acc and the SPG system was presented in Rickenmann (2017), indicating that all the three systems provide a generally similar signal response in terms of IMP counts and also in terms of maximum amplitudes (shown there for the GP-Acc and the SPG system only). In this study, we quantitatively compared the (linear) calibration relations for the three systems. We found that the GP-Acc, JPM, and SPG show similar and high-quality calibration relationships (Fig. 5, Table 5), including the Albula site (Fig. S14). As discussed above, the MPA system shows poorer calibration relationships than the SPG and GP-Acc systems (Fig. 6, Table 5). The poorer performance of the MPA may be partly due to the variability in the noise level, reflected by comparing the ratio of minute values of JPM/SPG and MPA/SPG over time for the Erlenbach site (Fig. S15), keeping in mind that the SPG system is a temporally stable and well-performing reference system. A second reason for the poorer performance of the MPA is a larger effect of changing flow velocity on the amplitude signal response for the MPA than for the SPG system (Fig. 11), and a third reason is the lacking sensitivity of the MPA system to sufficient signal (amplitude) response for particle sizes larger than about 76 mm (Figs. 8 and 9).
For all measuring systems, we generally observed a dependency of the relative accuracy of the impulse–bedload relation on the sampled bedload mass (Figs. 6 and 11). This has already been shown previously for the earlier version of the SPG system using a piezoelectric sensor instead of a geophone (Rickenmann and McArdell, 2007, 2008) and for the SPG system for which the scatter of the data defining the calibration relation was found to decrease with increasing sampled bedload mass (Rickenmann et al., 2012, 2014; Nicollier et al., 2022b) or with increasing bedload transport rate (Rickenmann and Fritschi, 2017; Nicollier et al., 2021).
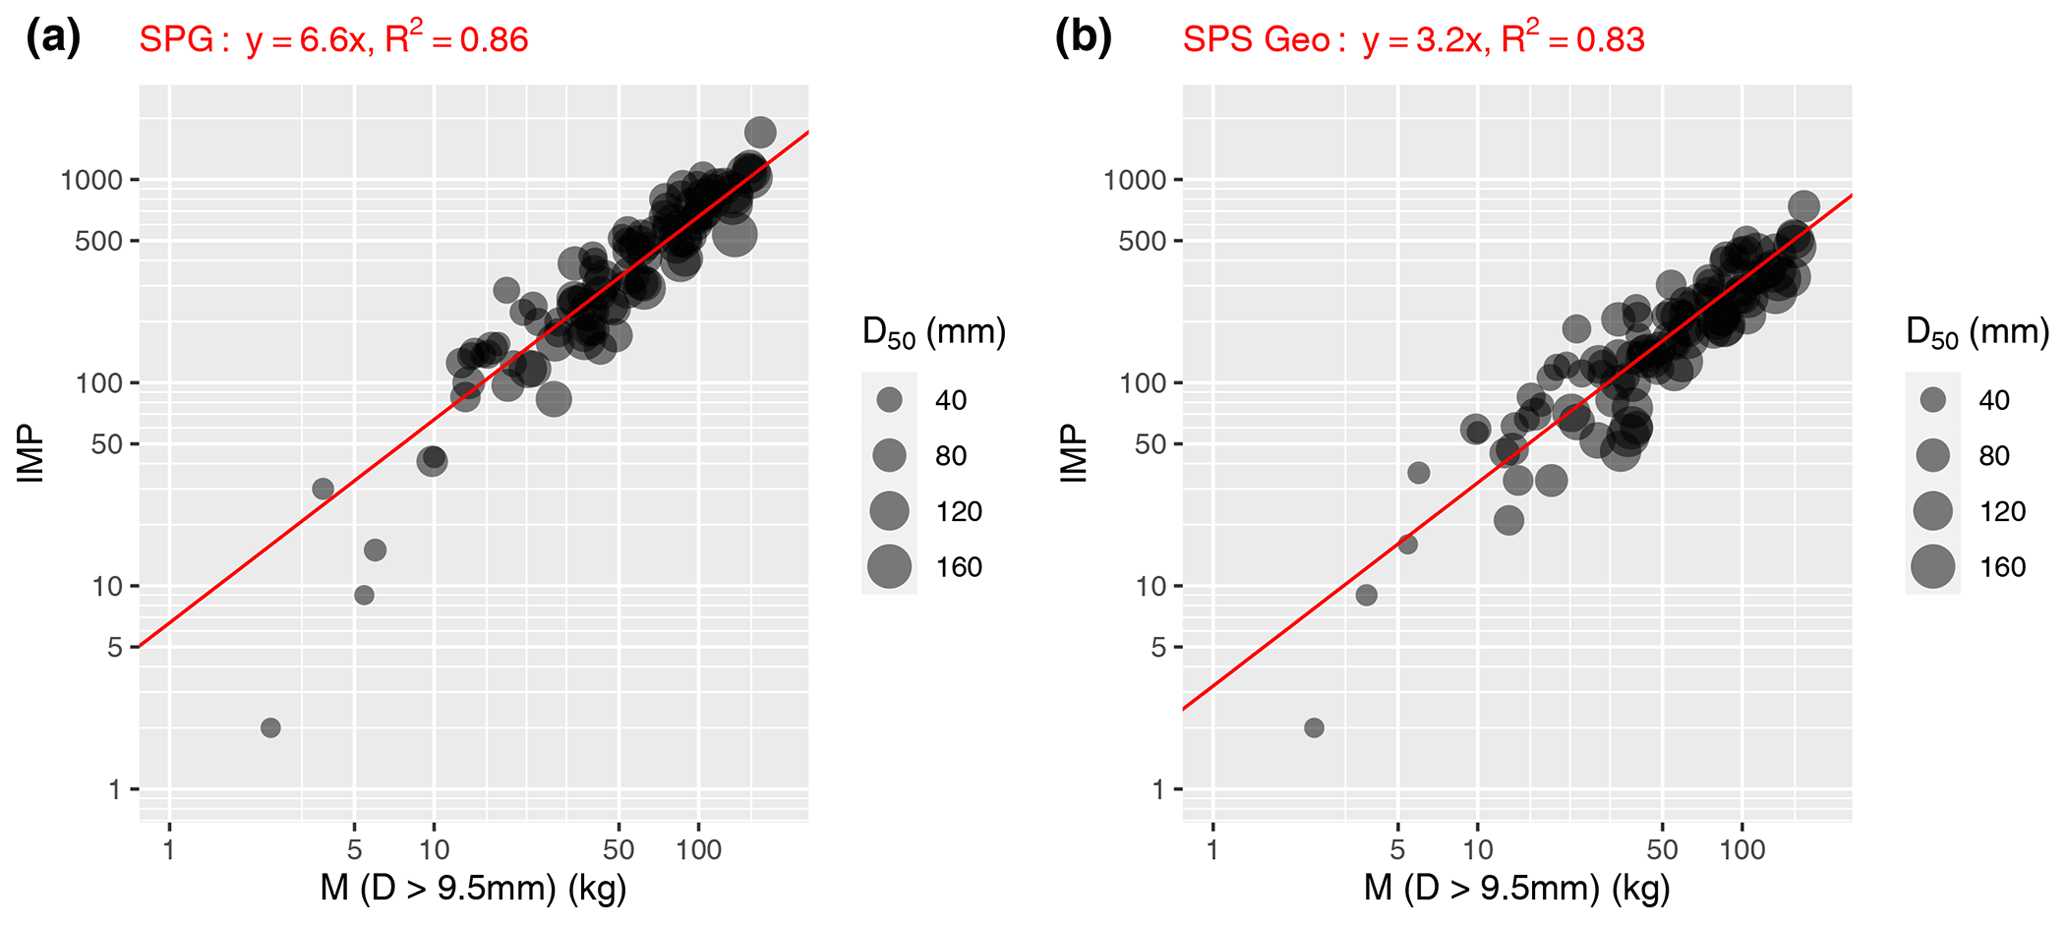
Figure 13Synthetic mixtures compiled from a varying number of randomly selected sorted grain size experiments in Obernach. Impulses and mass of bedload are the respective sums of the sorted grain size experiments that were selected for each synthetic mixture. (a) SPG system, (b) SPS. Geophone impulses measured with the two sensors.
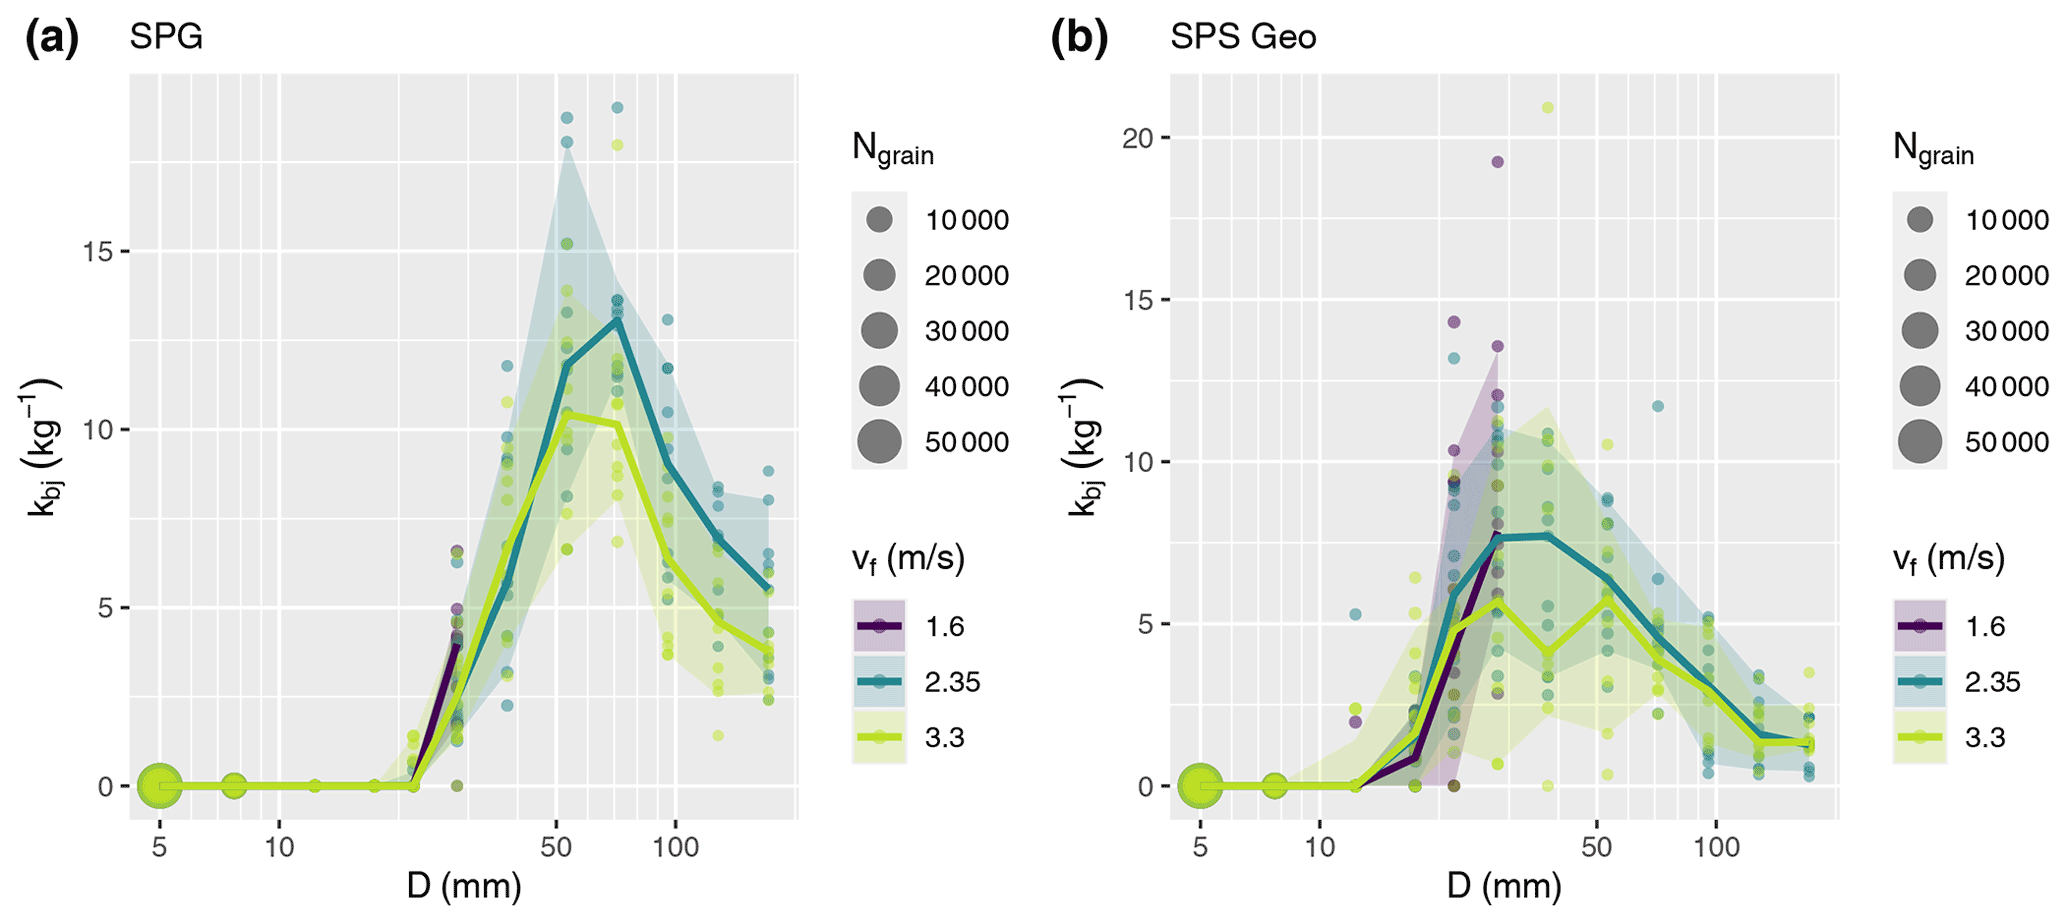
Figure 14Impulses per mass of bedload (kbj) for each grain size class j, as a function of grain size D. Only experiments from Obernach in summer 2021 for single grain size classes (sorted experiments) were used; vf is the water velocity 10 cm above the impact plates. (a) SPG system, (b) SPS. Geophone impulses measured with the two sensors. For the impulse counts, a threshold value Amin=0.1 V was used for both systems.
4.5 Preliminary experimental findings with a new prototype measuring device
Here we report about a preliminary analysis using a total of 287 sorted grain size experiments conducted in Obernach in summer 2021. Based on these observations, we made two types of analyses to make a direct comparison of the SPS and the SPG systems. First, we created 100 synthetic mixtures, for which we randomly selected between 2 and 20 out of the 287 sorted grain size experiments, and combined them together. For the SPS, we only used the IMP values determined from the two geophone sensors in this analysis. We then determined calibration relations between IMP and transported bedload mass M to represent a similar range to that for the field sites. Interestingly, the performance of the calibration relations is very similar for the SPG and SPS systems (Fig. 13). Second, we prepared plots showing the kbj values as a function of grain size D; kbj is defined similarly to Eq. (1), but separately for each grain size class j. From these graphs it is obvious that the two systems produce a similar signal response but that the SPS is somewhat more sensitive to the impact of smaller grains than the SPG (Fig. 14), which may be partly due to the somewhat more rigid structure of the SPS. Note that the longitudinal length (in flow direction) and the thickness of the SPS structure are significantly smaller compared to the SPG structure, resulting in a difference in the structural dynamic response under bedload particle impact.
Also including an accelerometer and a microphone sensor, apart from the two geophones, enhances the potential of the new prototype measuring device SPS to possibly better detect smaller particle sizes than the SPG system. Based on the sorted grain size experiments conducted in Obernach in summer 2021, and using the signal from all four sensors, a machine learning algorithm was applied to examine the ability to predict grain size from the recorded signal. The same approach was also applied to the measuring systems SPG and MPA. A simple and a complex feature set were created from the raw signal, and out of nine evaluated machine learning model types, CatBoost models in combination with the complex feature set performed best and achieved R2 scores above 0.8 for all measuring systems (Saritas et al., 2022). This confirms the potential of the SPS to be used in the future to determine fractional bedload transport rates, as it has already been demonstrated in more detail for the SPG system (Nicollier et al., 2022b).
Based on calibration measurements with direct bedload samples from three field sites and an outdoor flume facility with controlled sediment feed, we compared the performance of the SPG system with the three alternative surrogate measuring systems GP-Acc, JPM, and MPA. Our measurements at the field sites indicated that geophone sensors tend to produce a reliable signal over extended periods of time, whereas the accelerometer sensors seem to be more prone to signal instabilities. At the Albula field site, some unstable accelerometer sensors were hardly usable. This is presumably due to the requirement of a stable power supply, which can be difficult to maintain in field installations. If there are doubts as to whether a reliable and high-quality installation, operation, and maintenance are possible at a certain site, the use of accelerometer sensors such as the ones used in this study is to be examined with caution.
The approach of using impulse counts to approximate total bedload transport was found to work well for the SPG system. The same was true for the GP-Acc and the JPM for periods with a stable background signal, e.g. for the Erlenbach site for the period before June 2016. Applying impulse counts to approximate total bedload transport with the MPA system led to less accurate results. Comparing the signal response for different grain size classes, we found that the impulse count of the MPA is more sensitive to smaller grains (ca. 20–50 mm), while the SPG is more sensitive to larger grains (ca. 50–100 mm). Since the bedload samples used in this study tended to be dominated by the latter fraction, this could partially explain the better relationship between impulse and bedload mass for the SPG. It is reasonable to assume that the impulse–bedload relation of the MPA would be more accurate when applied to bedload material with a finer grain size distribution.
The construction of the MPA system with a relatively large volumetric proportion of elastomer material resulted in considerable dampening of the signal following the impact of larger grains. In addition, we found that the signal response of the MPA system was more variable for different flow velocities, particularly regarding the maximum amplitude and impulse counts, than that of the SPG system. As an outlook, the new and relatively cheap SPS prototype system is a more rigid structure than the MPA. The SPS is equipped with geophones, an accelerometer, and a microphone, with the idea of combining advantages of different systems. Preliminary observations at the Obernach flume site suggest that it can produce relatively stable impulse–bedload relations and that it has a good potential for particle size identification.
The datasets presented in Figs. 5, 6, 8, and 11 of this paper are available online on the EnviDat repository: https://www.envidat.ch/#/metadata/sediment-transport-observations-in-swiss-mountain-streams (Rickenmann et al., 2022).
The supplement related to this article is available online at: https://doi.org/10.5194/esurf-10-1165-2022-supplement.
DR, LA, TN, GA, CW, and AB conceived and planned the field measurements; DR and TN conceived and planned the flume experiments. SB and BF designed and built the data recording systems. LA, TN, GA, NS, ZC, and CW performed the measurements at the field sites and the flume. LA performed the majority of the data analysis and wrote a first draft of the manuscript. DR prepared the following versions, with contributions from all co-authors to the final version.
The contact author has declared that none of the authors has any competing interests.
Publisher's note: Copernicus Publications remains neutral with regard to jurisdictional claims in published maps and institutional affiliations.
We acknowledge the support of many colleagues at WSL and UNIL who helped set up and run the bedload transport measurements at the Erlenbach, the Albula, and the Avançon de Nant sites. We also appreciate the support of Arnd Hartlieb and his colleagues at the Obernach flume site of TU Munich, who helped perform the outdoor flume experiments.
The study was supported by the Swiss Federal Office for the Environment (contract no. 00.5027.PZ/5563FD038), the Swiss Federal Research Institute WSL, the University of Lausanne UNIL, and the Swiss National Science Foundation through grants 200021_137681 and 200021L_172606 to Dieter Rickenmann.
This paper was edited by Rebecca Hodge and reviewed by two anonymous referees.
Aberle, J., Rennie, C., Admiraal, D., and Muste, M. (Eds.): Experimental Hydraulics: Methods, Instrumentation, Data Processing and Management, in: Volume II: Instrumentation and Measurement Techniques, CRC Press, p. 448, ISBN 9781138038158, 2017.
Antoniazza, G., Nicollier, T., Wyss, C. R., Boss, S., and Rickenmann, D.: Bedload transport monitoring in alpine rivers: Variability in Swiss plate geophone response, Sensors, 20, 1–25, https://doi.org/10.3390/s20154089, 2020.
Antoniazza, G., Nicollier, T., Boss, S., Mettra, F., Badoux, A., Schaefli, B., Rickenmann, D., and Lane, S. L.: Hydrological drivers of bedload transport in an Alpine watershed, Water Resour. Res., 58, e2021WR030663, https://doi.org/10.1029/2021WR030663, 2022.
Bakker, M., Gimbert, F., Geay, T., Misset, C., Zanker, S., and Recking, A.: Field application and validation of a seismic bedload transport model, J. Geophys. Res.-Earth, 125, e2019JF005416, https://doi.org/10.1029/2019JF005416, 2020.
Barrière, J., Krein, A., Oth, A., and Schenkluhn, R.: An advanced signal processing technique for deriving grain size information of bedload transport from impact plate vibration measurements, Earth Surf. Proc. Land., 40, 913–924, https://doi.org/10.1002/esp.3693, 2015.
Beylich, A. and Laute, K.: Combining impact sensor field and laboratory flume measurements with other techniques for studying fluvial bedload transport in steep mountain streams, Geomorphology, 218, 72–87, https://doi.org/10.1016/j.geomorph.2013.09.004, 2014.
Bogen, J. and Møen, K.: Bed load measurements with a new passive acoustic sensor, in Erosion and Sediment Transport Measurement in Rivers: Trends and Explanation, IAHS Publ., 283, 181–182, 2003.
Bunte, K., Abt, S. R., Potyondy, J. P., and Ryan, S. E.: Measurement of coarse gravel and cobble transport using a portable bedload trap, J. Hydraul. Eng., 130, 879–893, https://doi.org/10.1061/(ASCE)0733-9429(2004)130:9(879), 2004.
Camenen, B., Jaballah, M., Geay, T., Belleudy, P., Laronne, J. B., and Laskowski, J. P.: Tentative measurements of bedload transport in an energetic alpine gravel bed river, in: River flow, September 2012, 379–386, https://hal.inrae.fr/hal-02597879 (last access: 23 March 2022), 2012.
Chen, Z., He, S., Nicollier, T., Ammann, L., Badoux, A., and Rickenmann, D.: Finite element modelling of the Swiss plate geophone bedload monitoring system, J. Hydraul. Res., 60, 792–810, https://doi.org/10.1080/00221686.2022.2059585, 2022a.
Chen, Z., He, S., Nicollier, T., Ammann, L., Badoux, A., and Rickenmann, D.: Signal response of the Swiss plate geophone monitoring system impacted by bedload particles with different transport modes, Earth Surf. Dynam., 10, 279–300, https://doi.org/10.5194/esurf-10-279-2022, 2022b.
Choi, J. H., Jun, K. W., and Jang, C. D.: Bed-Load Collision Sound Filtering through Separation of Pipe Hydrophone Frequency Bands, Water, 12, 1875, https://doi.org/10.3390/w12071875, 2020.
Coviello, V., Vignoli, G., Simoni, S., Bertoldi, W., Engel, M., Buter, A., Marchetti, G., Andreoli, A., Savi, S., and Comiti, F.: Bedload fluxes in a glacier-fed river at multiple temporal scales, Water Resour. Res., 58, e2021WR031873, https://doi.org/10.1029/2021WR031873, 2022.
Dietze, M., Lagarde, S., Halfi, E., Laronne, J. B., and Turowski, J. M.: Joint sensing of bedload flux and water depth by seismic data inversion, Water Resour. Res., 55, 9892–9904, https://doi.org/10.1029/2019WR026072, 2019.
Downs, P. W., Soar, P. J., and Taylor, A.: The anatomy of effective discharge: The dynamics of coarse sediment transport revealed using continuous bedload monitoring in a gravel-bed river during a very wet year, Earth Surf. Proc. Land., 41, 147–161, https://doi.org/10.1002/esp.3785, 2016.
Geay, T., Belleudy, P., Gervaise, C., Habersack, H., Aigner, J., Kreisler, A., Seitz, H., and Laronne, J. B.: Passive acoustic monitoring of bedload discharge in a large gravel bed river, J. Geophys. Res.-Earth, 122, 528–545, https://doi.org/10.1002/2016JF004112, 2017.
Geay, T., Zanker, S., Misset, C., and Recking, A.: Passive acoustic measurement of bedload transport: Toward a global calibration curve?, J. Geophys. Res.-Earth, 125, e2019JF005242, https://doi.org/10.1029/2019JF005242, 2020.
Gimbert, F., Fuller, B. M., Lamb, M. P., Tsai, V. C., and Johnson, J. P. L.: Particle transport mechanics and induced seismic noise in steep flume experiments with accelerometer-embedded tracers, Earth Surf. Proc. Land., 44, 219–241, https://doi.org/10.1002/esp.4495, 2019.
Gray, J. R., Laronne, J. B., and Marr, J. D. G. (Eds.): Bedload-surrogate Monitoring Technologies, US Geological Survey Scientific Investigations Report 2010-5091, US Geological Survey, Reston, VA, http://pubs.usgs.gov/sir/2010/5091 (last access: 11 November 2022), 2010.
Habersack, H., Kreisler, A., Rindler, R., Aigner, J., Seitz, H., Liedermann, M., and Laronne, J. B.: Integrated automatic and continuous bedload monitoring in gravel bed rivers, Geomorphology, 291, 80–93, https://doi.org/10.1016/j.geomorph.2016.10.020, 2017.
Helley, E. J. and Smith, W.: Development and calibration of a pressure-difference bedload sampler, Open-File Report 73-108, US Department of the Interior, Geological Survey, Water Resources Division, https://doi.org/10.3133/ofr73108, 1971.
Hilldale, R. C., Carpenter, W. O., Goodwiller, B., Chambers, J. P., and Randle, T. J.: Installation of impact plates to continuously measure bed load: Elwha River, Washington, USA, J. Hydraul. Eng., 141, 06014023, https://doi.org/10.1061/(ASCE)HY.1943-7900.0000975, 2015.
Koshiba, T. and Sumi, T.: Application of the wavelet transform to sediment grain sizes analysis with an impact plate for bedload monitoring in sediment bypass tunnels, Proc. River Flow 2018, E3S Web Conf., 40, 04022, https://doi.org/10.1051/e3sconf/20184004022, 2018.
Koshiba, T., Auel, C., Tsutsumi, D., Kantoush, S. A., and Sumi, T.: Application of an impact plate – Bedload transport measuring system for high-speed flows, Int. J. Sediment Res., 33, 35–46, https://doi.org/10.1016/j.ijsrc.2017.12.003, 2018.
Krein, A., Klinck, H., Eiden, M., Symader, W., Bierl, R., Hoffmann, L., and Pfister, L.: Investigating the transport dynamics and the properties of bedload material with a hydro-acoustic measuring system, Earth Surf. Proc. Land., 33, 152–163, https://doi.org/10.1002/esp.1576, 2008.
Kreisler, A., Moser, M., Aigner, J., Rindler, R., Tritthard, M., and Habersack, H.: Analysis and classification of bedload transport events with variable process characteristics, Geomorphology, 291, 57–68, https://doi.org/10.1016/j.geomorph.2016.06.033, 2017.
Kuhnle, R., Wren, D., Hilldale, R. C., Goodwiller, B., and Carpenter, W.: Laboratory Calibration of Impact Plates for Measuring Gravel Bed Load Size and Mass, J. Hydraul. Eng., 143, 06017023, https://doi.org/10.1061/(ASCE)HY.1943-7900.0001391, 2017.
Levinzon, P.: Piezoelectric Accelerometers with Integral Electronics, Springer, Heidelberg, p. 169, ISBN 978-3-319-08077-2, 2015.
Mao, L., Carrillo, R., Escauriaza, C., and Iroume, A.: Flume and field-based calibration of surrogate sensors for monitoring bedload transport, Geomorphology, 253, 10–21, https://doi.org/10.1016/j.geomorph.2015.10.002, 2016.
Mizuyama, T., Laronne, J. B., Nonaka, M., Sawada, T., Satofuka, Y., Matsuoka, M., Yamashita, S., Sako, Y., Tamaki, S., Watari, M., Yamaguchi, S., and Tsuruta, K.: Calibration of a passive acoustic bedload monitoring system in Japanese mountain rivers, in: Bedload-surrogate Monitoring Technologies, edited by: Gray, J. R., Laronne, J. B., and Marr, J. D. G., US Geological Survey Scientific Investigations Report 2010-5091, US Geological Survey, Reston, VA, 296–318, http://pubs.usgs.gov/sir/2010/5091/papers/listofpapers.html (last access: 11 Novembe 2022), 2010a.
Mizuyama, T., Oda, A., Laronne, J. B., Nonaka, M., and Matsuoka, M.: Laboratory tests of a Japanese pipe geophone for continuous acoustic monitoring of coarse bedload, in: Bedload-surrogate Monitoring Technologies, edited by: Gray, J. R., Laronne, J. B., and Marr, J. D. G., US Geological Survey Scientific Investigations Report 2010-5091, US Geological Survey, Reston, VA, 319–335, http://pubs.usgs.gov/sir/2010/5091/papers/listofpapers.html (last access: 11 Novembe 2022), 2010b.
Nicollier, T., Rickenmann, D., and Hartlieb, A.: Field and flume measurements with the impact plate: Effect of bedload grain-size distribution on signal response, Earth Surf. Proc. Land., 46, 1504–1520, https://doi.org/10.1002/esp.5117, 2021.
Nicollier, T., Antoniazza, G., Rickenmann, D., Hartlieb, A., and Kirchner, J. W.: Improving the Calibration of Impact Plate Bedload Monitoring Systems by Filtering Out Acoustic Signals from Extraneous Particle Impacts, Earth Space Sci., 9, e2021EA001962, https://doi.org/10.1029/2021EA001962, 2022a.
Nicollier, T., Antoniazza, G., Ammann, L., Rickenmann, D., and Kirchner, J. W.: Toward a general calibration of the Swiss plate geophone system for fractional bedload transport, Earth Surf. Dynam., 10, 929–951, https://doi.org/10.5194/esurf-10-929-2022, 2022b.
Onajite, E.: Seismic Data Analysis Techniques in Hydrocarbon Exploration, in: chap. 8, Understanding Sample Data, Elsevier, Amsterdam, 105–115, https://doi.org/10.1016/B978-0-12-420023-4.00008-3, 2014.
Raven, E. K., Lane, S. N., Ferguson, R. I., and Bracken, L. J.: The spatial and temporal patterns of aggradation in a temperate, upland, gravel-bed river, Earth Surf. Proc. Land., 34, 1181–1197, 2009.
Raven, E. K., Lane, S. N., and Ferguson, R.: Using sediment impact sensors to improve the morphological sediment budget approach for estimating bedload transport rates, Geomorphology, 119, 125–134, https://doi.org/10.1016/j.geomorph.2010.03.012, 2010.
Reid, S. C., Lane, S. N., and Berney, J. M.: The timing and magnitude of coarse sediment transport events within an upland gravel-bed river, Geomorphology, 83, 152–182, 2007.
Richardson, K., Benson, I., and Carling, P. A.: An instrument to record sediment movement in bedrock channels, in: Erosion and sediment transport measurement in rivers: Technological and methodological advances, edited by: Bogen, J., Fergus, T., and Walling, D. E., IAHS, Wallingford, UK, 228–235, ISBN 978-1-901502-42-8, 2003.
Rickenmann, D.: Bed-load transport measurements with geophones and other passive acoustic methods, J. Hydraul. Eng., 143, 03117004-1-14, https://doi.org/10.1061/(ASCE)HY.1943-7900.0001300, 2017a.
Rickenmann, D.: Bedload transport measurements with geophones, hydrophones and underwater microphones (passive acoustic methods), in: Gravel Bed Rivers: Processes and Disasters, edited by: Tsutsumi, D. and Laronne, J. B., Wiley, 185–208, ISBN 978-1-118-97140-6, 2017b.
Rickenmann, D. and McArdell, B. W.: Continuous measurement of sediment transport in the Erlenbach stream using piezoelectric bedload impact sensors, Earth Surf. Proc. Land., 32, 1362–1378, https://doi.org/10.1002/esp.1478, 2007.
Rickenmann, D. and McArdell, B. W.: Calibration of piezoelectric bedload impact sensors in the Pitzbach mountain stream, Geodinamica Acta, 21, 35–52, 2008.
Rickenmann, D. and Fritschi, B.: Bedload transport measurements with impact plate geophones in two Austrian mountain streams (Fischbach and Ruetz): system calibration, grain size estimation, and environmental signal pick-up, Earth Surf. Dynam., 5, 669–687, https://doi.org/10.5194/esurf-5-669-2017, 2017.
Rickenmann, D., Turowski, J. M., Fritschi, B., Klaiber, A., and Ludwig, A.: Bedload transport measurements at the Erlenbach stream withgeophones and automated basket samplers, Earth Surf. Proc. Land., 37, 1000–1011, https://doi.org/10.1002/esp.3225, 2012.
Rickenmann, D., Turowski, J. M., Fritschi, B., Wyss, C., Laronne J. B., Barzilai, R., Reid, I., Kreisler, A., Aigner, J., Seitz, H., and Habersack, H.: Bedload transport measurements with impact plate geophones: comparison of sensor calibration in different gravel-bed streams, Earth Surface Proc. Land., 39, 928–942, https://doi.org/10.1002/esp.3499, 2014.
Rickenmann, D., Nicollier, T., Boss, S., and Badoux, A.: Four years of bedload transport measurements in the Swiss Mountain River Albula, in: River flow 2020, edited by: Uijttewaal, W., Franca, M. J., Valero, D., Chavarrias, V., Ylla Arbós, C., Schielen, R., and Crosato, A., CRC Press, London, 1749–1755, https://doi.org/10.1201/b22619-245, 2020.
Rickenmann, D., Antoniazza, G., Nicollier, T., Wyss, C., Boss, S., Fritschi, B., Steeb, N., and Badoux, A.: Sediment transport observations in Swiss mountain streams, EnviDat [data set], https://www.envidat.ch/#/metadata/sediment-transport-observations-in-swiss-mountain-streams, last access: 11 November 2022.
Roth, D. L., Brodsky, E. E., Finnegan, N. J., Rickenmann, D., Turowski, J. M., and Badoux, A.: Bed load sediment transport inferred from seismic signals near a river, J. Geophys. Res.-Earth, 121, 725–747, https://doi.org/10.1002/2015JF003782, 2016.
Saritas, F., Staehli, S., Ammann, L., Rickenmann, D., Custer, R., and Suter, S.: Using Acoustic Signal to Predict Grain Size of Bedload Particles, in: Proceedings of the 9th Swiss Conference on Data Science, 22–23 June 2022, Lucerne, Switzerland, https://doi.org/10.1109/SDS54800.2022.00017, 2022.
Thorne, P. D.: Laboratory and marine measurements on the acoustic detection of sediment transport, J. Acoust. Soc. Am., 80, 899–910, https://doi.org/10.1121/1.393913, 1986.
Thorne, P. D.: An overview of underwater sound generated by inter-particle collisions and its application to the measurements of coarse sediment bedload transport, Earth Surf. Dynam. 2, 531–543, https://doi.org/10.5194/esurf-2-531-2014, 2014.
Tsakiris, A. G., Papanicolaou, A. N., and Lauth, T.: Signature of bedload particle transport mode in the acoustic signal of a geophone, J. Hydraul. Res., 52, 185–204, https://doi.org/10.1080/00221686.2013.876454, 2014.
Tsutsumi, D., Fujita, M., and Nonaka, M.: Transport measurement with a horizontal and a vertical pipe microphone in a mountain stream: taking account of particle saltation, Earth Surf. Proc. Land., 43, 1118–1132, https://doi.org/10.1002/esp.4297, 2018.
Wyss, C. R., Rickenmann, D., Fritschi, B., Turowski, J., Weitbrecht, V., and Boes, R.: Measuring bed load transport rates by grain-size fraction using the Swiss plate geophone signal at the Erlenbach, J. Hydraul. Eng., 142, 04016003, https://doi.org/10.1061/(ASCE)HY.1943-7900.0001090, 2016a.
Wyss, C. R., Rickenmann, D., Fritschi, B., Turowski, J., Weitbrecht, V., and Boes, R.: Laboratory flume experiments with the Swiss plate geophone bed load monitoring system: 1. Impulse counts and particle size identification, Water Resour. Res., 52, 7744–7759, https://doi.org/10.1002/2015WR018555, 2016b.
Wyss, C. R., Rickenmann, D., Fritschi, B., Turowski, J., Weitbrecht, V., Travaglini, E., Bardou, E., and Boes, R.: Laboratory flume experiments with the Swiss plate geophone bed load monitoring system: 2. Application to field sites with direct bed load samples, Water Resour. Res., 52, 7760–7778, https://doi.org/10.1002/2016WR019283, 2016c.