the Creative Commons Attribution 4.0 License.
the Creative Commons Attribution 4.0 License.
 | 16 Sep 2024
How water, temperature, and seismicity control the preconditioning of massive rock slope failure (Hochvogel)
Johannes Leinauer
Michael Dietze
Sibylle Knapp
Riccardo Scandroglio
Maximilian Jokel
Michael Krautblatter
The anticipation of massive rock slope failures is a key mitigation strategy in a changing climate and environment requiring a precise understanding of pre-failure process dynamics. Here we exploit >4 years of multi-method high-resolution monitoring data from a large rock slope instability close to failure. To quantify and understand the effect of possible drivers (water from rain and snowmelt, internal rock fracturing, and earthquakes), we correlate slope displacements with environmental data, local seismic recordings, and earthquake catalogues. During the snowmelt phase, displacements are controlled by meltwater infiltration with high correlation and a time lag of 4–9 d. During the snow-free summer, rainfall induces accelerations with a time lag of 1–16 h for up to several days without a minimum activation rain sum threshold. Rock fracturing, linked to temperature and freeze–thaw cycles, is predominantly near the surface and unrelated to displacement rates. A classic Newmark analysis of recent and historic earthquakes indicates a low potential for immediate triggering of a major failure at the case site, unless it is already very close to failure. Seismic topographic amplification of the peak ground velocity (PGV) at the summit ranges from a factor of 2–11 and is spatially heterogeneous, indicating a high criticality of the slope. The presented in-depth monitoring data analysis enables a comprehensive rockfall driver evaluation and indicates where future climatic changes, e.g. in precipitation intensity and frequency, may alter the preconditioning of major rock slope failures.
- Article
(7222 KB) - Full-text XML
-
Supplement
(6954 KB) - BibTeX
- EndNote


Massive rock slope failures are an important geomorphic hazard (e.g. Evans et al., 2006; Lacasse and Nadim, 2009), and, in the wake of climate change, landslide risk is expected to increase in many regions (e.g. Gariano and Guzzetti, 2016; Picarelli et al., 2021). To prevent damage to people or property, the anticipation of such events becomes highly crucial (Sättele et al., 2016; Chae et al., 2017; Pecoraro et al., 2019; Leinauer et al., 2023); thus, relevant drivers and potential triggers of imminent failures must be identified and understood. Currently, the capacity to monitor all hazardous rock slopes in a way that allows site-specific process analyses is non-existent. We must therefore rely on standard and qualitative rockfall triggering factors or, better, quantify the relevant drivers based on multi-method high-resolution monitoring data at well-equipped sites. Exploiting the available data of comprehensive monitoring and early warning systems to gain understanding of all relevant pre-failure process dynamics should therefore become a standard procedure (Gischig et al., 2016), allowing the inference of trigger anticipation strategies for similar slopes.
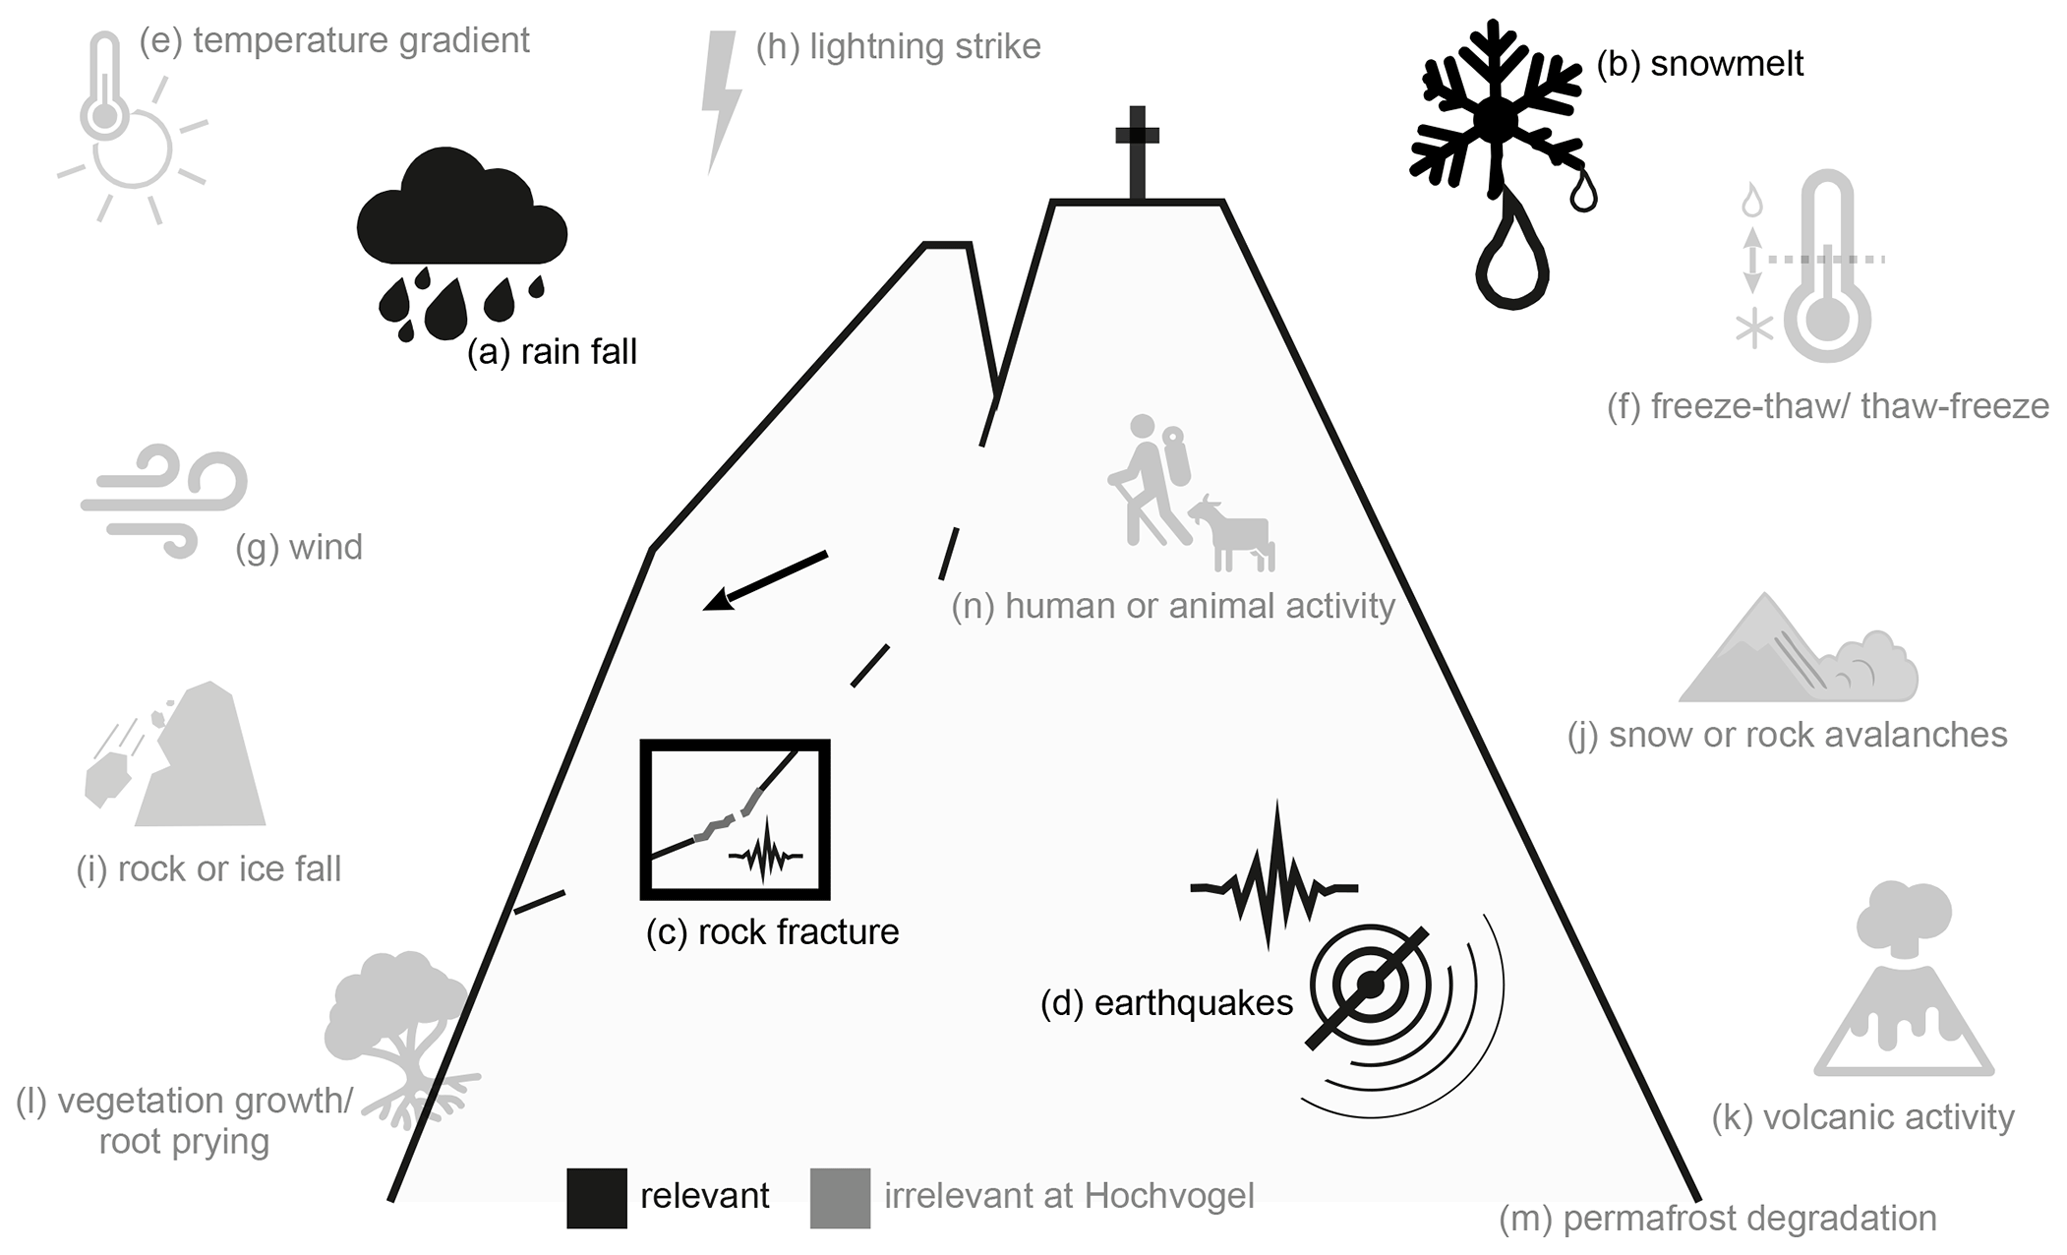
Figure 1Factors that can potentially promote and/or trigger rockfalls. Black processes (a–d) are relevant for a major failure at our case site, Hochvogel, and grey ones (e–n) can be excluded due to the reasons in the text.
Rockfall release can be caused by a reduction in resisting forces and/or an increase in driving forces. In the preparation phase, promoting drivers act on a rock slope over months to millions of years (Dietze et al., 2017b), bringing the system progressively closer towards critical slope stability (Oswald et al., 2021). This is achieved by the development of a sliding plane over different timescales, e.g. through seasonal pore pressure increase (Preisig et al., 2016), multi-year seismic loading (Gischig et al., 2016), long-term fracture propagation following weathering and erosion, glacial debuttressing (Eberhardt et al., 2004; Ballantyne et al., 2014), or permafrost degradation (Hilger et al., 2021). Finally, at failure, a trigger acts on the balance between stabilizing forces and stress, leading to unstable conditions initiating rockfall within a short time (Wieczorek, 1996). Of course, promoting drivers in the preparation phase and triggering factors terminating this phase can overlap and interact, and the transition between the two may be gradual. In some cases the progressive weakening of material could lead to slope failure without an apparent external trigger (Lagarde et al., 2023), but, in such a state, the rock slope instability becomes increasingly sensitive to external drivers. However, a detailed and comprehensive knowledge of how and how much internal and external drivers control the pre-failure stage of imminent rock slope failures is missing at most sites, even though it is crucial for anticipation tasks.
Possible rockfall drivers and triggers (Fig. 1) include (e.g. Stock et al., 2013; Dietze et al., 2017b) (a) rainfall, (b) snowmelt, (c) rock fracturing and crack propagation, (d) earthquakes, (e) temperature gradients, (f) freeze–thaw cycles, (g) wind, (h) lightning, (i) rock- or icefall inducing secondary rockfall, (j) snow or rock avalanches, (k) volcanic activity, (l) vegetation growth and root prying, (m) permafrost degradation (Krautblatter et al., 2013), and (n) human or animal activity. The significance of some of these factors might change in the future due to climatic fluctuations. Temperature and precipitation patterns are expected to change in many regions (IPCC, 2019), expressed by a general warming, modified extreme rain events, or snow cover shifts (e.g. Huss et al., 2017; Pendergrass et al., 2019). This influences the timing and amount of available water in the system or rock/ice properties; thus, the sensitivity of affected drivers to climate change should be evaluated (e.g. Agliardi et al., 2020; see Sect. 4.6).
Heavy precipitation and rapid snowmelt are documented to be amongst the most important drivers for rockslides across the globe (e.g. Wieczorek, 1996; Helmstetter and Garambois, 2010; Stock et al., 2013; LaHusen et al., 2020). Infiltrating water can destabilize rock slopes repeatedly on short timescales by building hydrostatic pressure in fractures, elimination of the joint cohesion, lowering of the joint friction angle, and reduction in the effective normal stress at the sliding surface due to uplift (Erismann and Abele, 2001; Wyllie and Mah, 2004; Scandroglio et al., 2021). Large amounts of water can infiltrate into slopes due to simultaneous intense snowmelt and rainfall, especially in spring (Kawagoe et al., 2009; Krøgli et al., 2018; Lorenzi et al., 2024). Additionally, long-term hydro-mechanical loading cycles are proven to have a promoting effect on deep-seated landslides (Gischig et al., 2016). Constraining the amount of water, specifically the pore pressure inside a rock slope, is challenging without the availability of boreholes. In such cases, the direct measurement of the water supply via rain gauges or snow stations is easier to obtain.
Progressive crack propagation in fracturing rock is one of the main internal drivers of rock slope failures (Petley, 2004; Lagarde et al., 2023). Critical and subcritical crack growth along active sliding planes intensifies the stress concentration at the crack tips (e.g. Amitrano and Helmstetter, 2006; Voigtländer et al., 2018); as with every failing rock bridge, the stress increases at the remaining rock bridges (Kemeny, 2003). Once most rock bridges have been degraded, episodic deformation release might be controlled by macro-roughness creating obstacles along the sliding plane (Borri-Brunetto et al., 2004; Dietze et al., 2021). Stress release in the form of rock fracturing generates typical and distinguishable seismic signals that can be recorded with local seismic networks (Senfaute et al., 2009; Helmstetter and Garambois, 2010; Hibert et al., 2011; Provost et al., 2017; Dietze et al., 2021; Lagarde et al., 2023). Isolating the episodically occurring short events within the large data sets is challenging with manual techniques; thus, established machine learning procedures can help to build a database of rock fracturing events (Provost et al., 2017; Hibert et al., 2017; Wenner et al., 2021; Langet and Silverberg, 2023).
Earthquakes frequently trigger numerous landslides (e.g. Wieczorek, 1996; Jibson et al., 2006; Meunier et al., 2007; LaHusen et al., 2020; Marc et al., 2016; Massey et al., 2022). They seem to have played a significant role in preparing and triggering prehistoric large rockslides due to the spatiotemporal coincidence of major earthquakes and rock slope failures (Knapp et al., 2018; Oswald et al., 2021). The correlation of landslide occurrence and volume with peak ground acceleration (PGA) values (Meunier et al., 2007; Massey et al., 2022) reinforces the destabilizing nature of strong seismic waves, but recurring earthquakes are a further promoting factor due to seismic fatigue (Gischig et al., 2016; Oswald et al., 2021). Earthquake waves add additional stress to slope instabilities by accelerating the ground with a specific amount of energy for a limited time depending on frequency and direction. This ground motion can be measured directly at an instrumented instability with the same local seismometers that also record rock fracturing. If direct observations at the site of interest are not available, theoretical block displacements can be estimated with the well-known Newmark analysis (Newmark, 1965). This method allows us to evaluate historic earthquakes from earthquake catalogues or systematic parameter sets towards their triggering potential and deformational influence. In steep topography, it is furthermore important to consider frequency-dependent seismic wave amplification due to topographic site effects (Harp and Jibson, 2002; Sepúlveda et al., 2005; Lee et al., 2009a, b; Khan et al., 2020). Through topographic resonance and refraction of waves, seismic amplification can reach factors of 2–14 in the horizontal component at specific frequencies, predominantly triggering landslides at mountain tops and ridge crests facing away from the epicentre (Meunier et al., 2008; Bakun-Mazor et al., 2013; Rault et al., 2020; Weber et al., 2022). Moreover, seismic waves can be amplified and polarized within unstable rock mass itself due to existent open cracks that are mainly perpendicular to them (Burjánek et al., 2010, 2012). Gischig et al. (2016) found modelling evidence that amplification factors increase and become more complex in space and frequency with a higher degree of slope damage, which may in turn be used for assessing the slope's criticality. However, comprehensive site-specific analyses of how seismicity controls the preparation phase of rock slope failures based on field observations and historical earthquakes are usually not performed.
In this study, we focus on massive rock slope failures, i.e. >20 000 m3 (Evans et al., 2006). We use a well-prepared high-magnitude alpine rock slope instability in dolomite rock at the summit of the Hochvogel (2592 m a.s.l.; see details in Sect. 2), where we conducted multi-method high-resolution monitoring for more than 4 years. Due to the magnitude, location, and altitude of the rock slope instability, some generic drivers or triggers can be assumed irrelevant (Fig. 1). Strong temperature gradients and freeze–thaw cycles can only affect near-surface rock mass (Bakun-Mazor et al., 2013; Weber et al., 2017) without reaching deeper-seated sliding zones. The effect of wind is mostly connected to trees with roots (Stock et al., 2013; Dietze et al., 2015), which are absent at the Hochvogel; seismic noise (Lott et al., 2017); and pressure differences at the rock surface (Stock et al., 2013), which do not reach deep-seated sliding zones. Thus, wind can potentially induce small-scale rockfall, but a significant influence on several thousand cubic metres of rock is unrealistic. The same applies to lightning strikes. Excluding large-scale slope engineering, this likewise holds for human or animal activity. As the Hochvogel rock slope instability is located at the summit of the mountain, no rock- or icefall can impact the instability. The same applies to snow or rock avalanches. Volcanic activity is absent in this region. Due to its altitude, the Hochvogel summit is above the treeline but below the permafrost limit. Thus, four relevant drivers remain and are extensively analysed in this study: (i) rainfall-provided water, (ii) snowmelt-derived water, (iii) stress-induced rock fracturing, and (iv) seismic acceleration. Here, we analyse displacements as the phenomenological result of all drivers and correlate them with (i + ii) meteorological data, (iii + iv) local seismic recordings, and (iv) earthquake catalogues. This approach allows us to quantitatively evaluate promoting and triggering factors for many massive rock failures with a set of triggering conditions similar to our case study.
The Hochvogel (2592 m a.s.l.) is an isolated mountain peak with high topographic prominence in the eastern Allgäu Alps on the border between Germany and Austria (Fig. 2a). It consists of brittle, well-layered, and deformed dolomite rock (Hauptdolomit) from the Upper Triassic Lechtal nappe with incidental marly interlayers. The small-scale variation in rock properties is mainly due to the layering, but minor faults and folds add additional spatial heterogeneity. The summit area is characterized by a 2–6 m wide main crack that divides the massif into a stable NE side and an unstable SW side. The total unstable volume sums up to 260 000 m3 above a distinct 1 m thick marly layer (Fig. 2b-A, Leinauer et al., 2020). Including a potentially unstable mass below, the total volume reaches 400 000–600 000 m3. The rock slope instability has been developing since at least the 1940s, with higher deformation rates of about 2 cm a−1 during the last 2 decades, and is currently preparing to (partially) fail. Several lateral cracks at the almost vertical SW wall have shown higher activity in the last decade. This flank shows frequent failure of rock towers, for example, a 130 000 m3 rockfall in 2016 (Fig. 2b-B, Barbosa et al., 2024). The site has been under comprehensive monitoring since 2018 (Leinauer et al., 2021; Dietze et al., 2021), including observation of crack opening, temperature, rain, and seismic signals. A detailed description can be found in Leinauer et al. (2020).
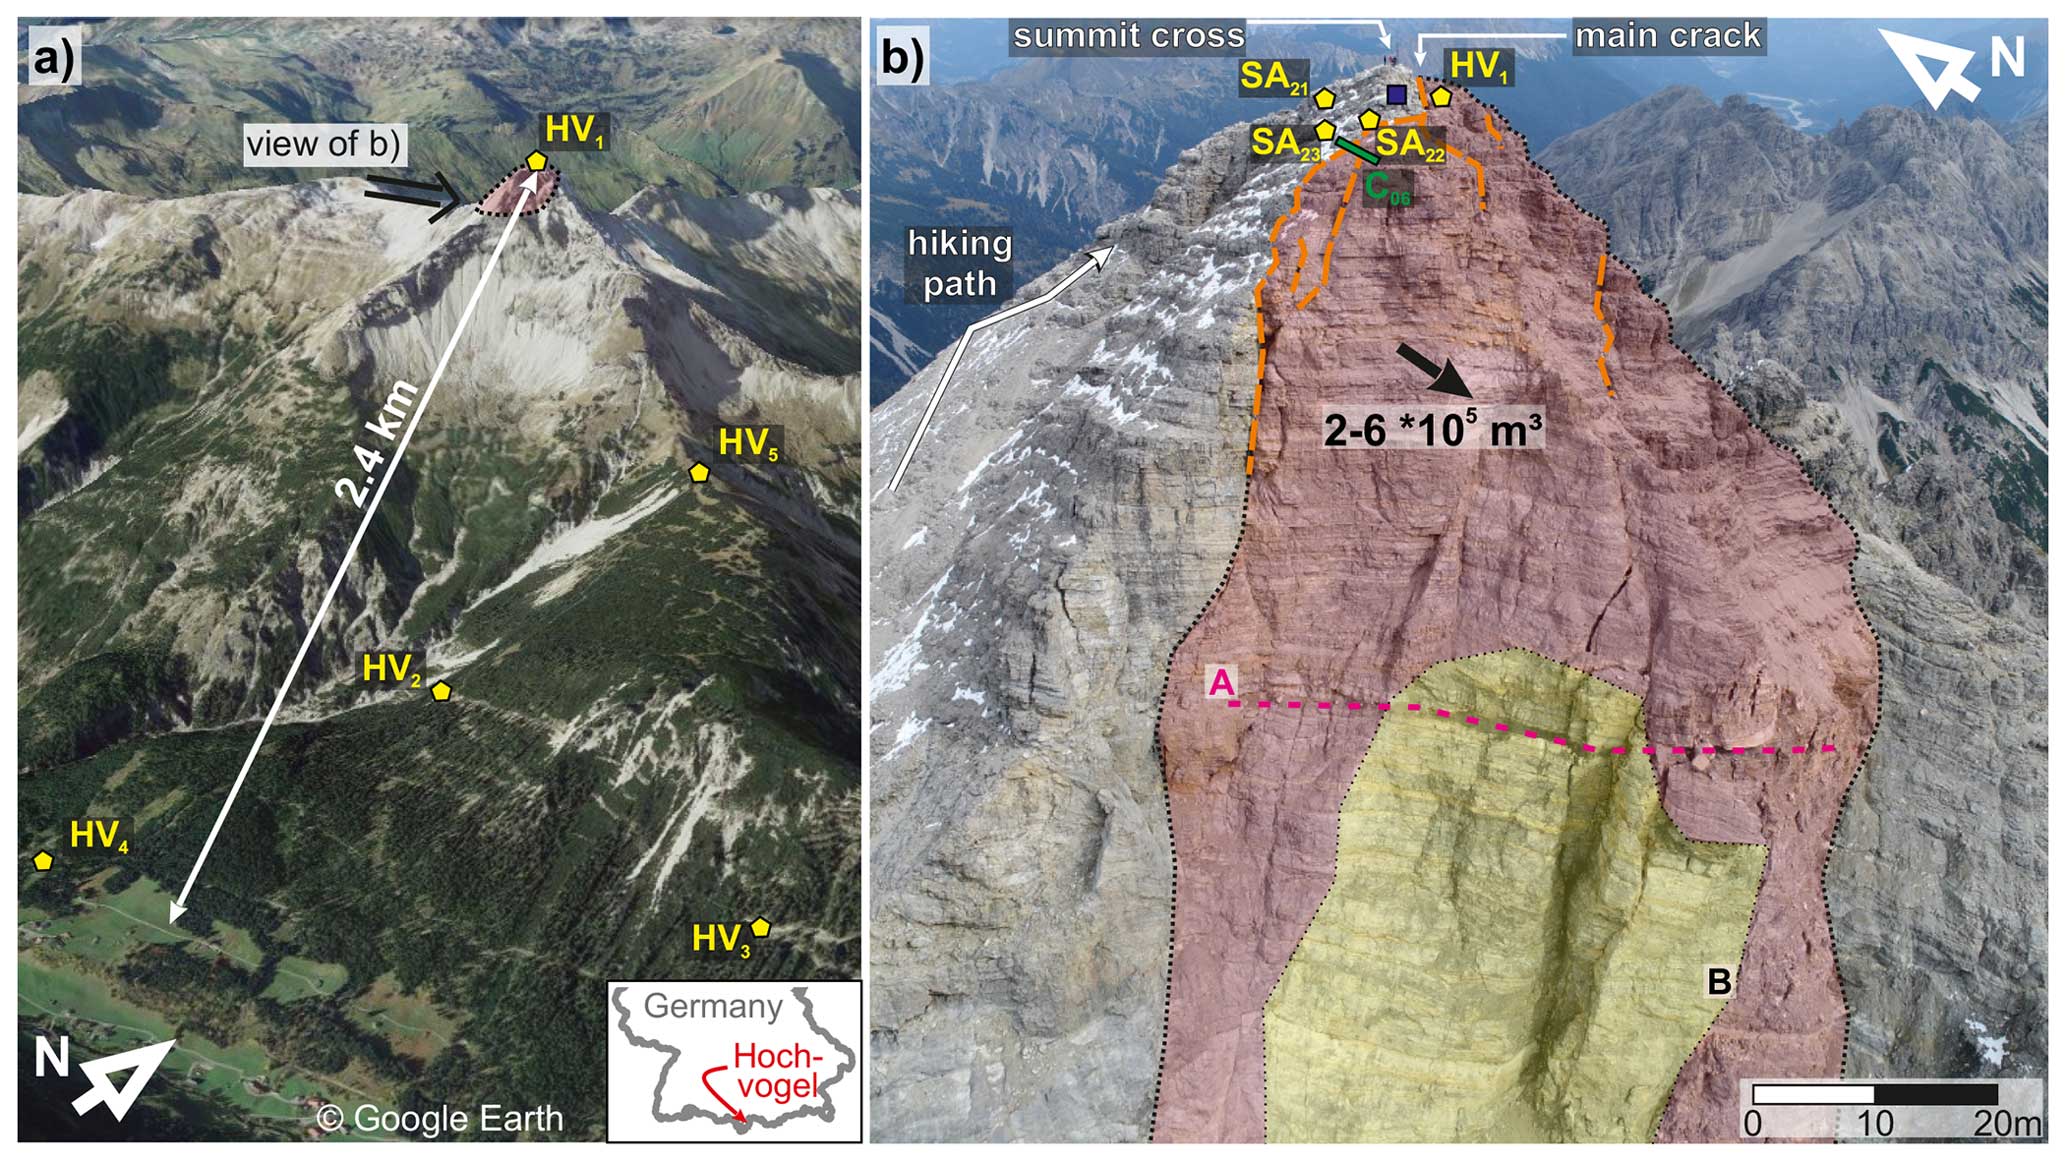
Figure 2Overview of the study site. (a) The Hochvogel with the unstable mass at the summit (red area) and the seismic stations of the flank network (yellow pentagons). The village of Hinterhornbach, Austria, in the valley below the Hochvogel is in the bottom left of the image. Image source: © Google Earth 2024. (b) Photo of the summit area and the steep SW wall. The unstable mass is marked with the red area, and obvious cracks are traced by dashed orange lines. Measurement devices in this study include the stations of the seismic summit network (yellow pentagons), a rain gauge (blue square), and a crackmeter “C06” (green line). A distinct 1 m thick marly layer is marked by the dashed magenta line (A). The source area of a 130 000 m3 rockfall from 2016 is marked with the yellow area (perimeter B).
In this study, we exploit several high-resolution data from between October 2018 and November 2022. This includes displacements measured as crack openings by a vibrating wire crackmeter (Crack06) at the most active lateral crack (see photos in Figs. S1 and S2 in the Supplement). Measurements are available with 10 min frequency from our real-time monitoring system (resolution 0.04 mm, accuracy ±0.15 mm). With the same frequency, the air temperature is measured directly at the crackmeter and rainfall is measured with a non-heated tipping-bucket rain gauge (resolution 0.1 mm; see photo in Fig. S3).
To monitor seismic processes, we installed a local seismic network on the summit consisting of four PE-6/B 4.5 Hz three-component geophones and DiGOS DATA-CUBE3 loggers (maximum distance 75 m). Three of the sensors (SA21, SA22, and SA23) are on the stable side, and one station (HV1) is on the unstable side next to the main crack (Fig. 2b; see photos of the seismic stations in Figs. S4 and S5). Additionally, we installed a wider network with spacings between 0.9 and 1.6 km on the SW flank below the summit, consisting of TC120s or PE-6/B geophones and DATA-CUBE3 or DATA-CUBE3 BOB loggers (Fig. 2a). All stations recorded ground velocity values at 100–400 Hz, but signals were uniformly aggregated to 100 Hz before further analysis. The station metadata are listed in Table S1 in the Supplement.
Data for snowmelt modelling come from two stations of the Bavarian Avalanche Warning Service in the region of the Hochvogel (yellow diamonds in Fig. S26) that measure all necessary parameters (wind, surface and air temperature, and snow height). The Nebelhorn (2075–2220 m a.s.l.) station is 9 km away from the Hochvogel, and the Zugspitze station (2420–2960 m a.s.l.) is 41 km away.
To analyse the effect of local or regional earthquakes, we exploit the earthquake event catalogues of Germany (BGR, 2023) and Switzerland (SED, 2023) containing all registered regional earthquakes with Mw>2 since AD 1692 and 250, respectively. Continuous observations with sub-second resolution have been available since 1975 and 2009, respectively. To study the effect of strong, distant earthquakes during station operation of our local seismic network, we use the catalogue of the US Geological Survey (USGS, 2023).
All data were processed with the software R v4.3.0 (R Core Team, 2023). R scripts of all major processing and analysis steps are available in an online repository at https://doi.org/10.5281/zenodo.10567098 (Leinauer, 2024). For the availability of the underlying data, see the Code and data availability statement.
3.1 Seismic crack events
All seismic analysis was performed with the R package eseis v0.7.3 (Dietze, 2018a, b). To obtain corrected ground velocity time series (m s−1), the seismic data were deconvolved according to the specifications of each instrument (see Table S1). Using the data from the summit network, we isolated discrete seismic events. We selected all times during which at least two stations operated simultaneously (860 d, 60 % coverage) to include only events that were captured by more than one station. The basic picking routine then followed the approach by Dietze et al. (2021), using a classic short‐term average / long‐term average (STA / LTA) ratio picker (Allen, 1882), applied to the 20–40 Hz filtered signal envelopes (on-ratio 6, off-ratio 1, STA window 0.2 s, LTA window 120 s). With these settings, even low-energy events were detected, but so were many false positives. The following automatic check of potential events premises an event duration of 0.2–5 s as the typical duration of discrete rock fracturing activity at the summit (e.g. Senfaute et al., 2009; Dietze et al., 2017a, 2021). Furthermore, the detection time difference between two stations needs to be less than 0.3 s according to a conservative wave travel time across the entire network. This excludes signals with longer detection time differences that result from the coincidence of unrelated signals or waves initiated by sound travelling through air. This led to a detection of 109 492 picked potential events for which we plotted seismograms and spectrograms. A meaningful localization of the signal source was hindered due to the steep and complex topography, highly jointed rock mass, and unclear wave velocity distribution (cp. Helmstetter and Garambois, 2010).
Finally, to sort the picked events into two groups of seismic rock fracturing events (target) and other events (human steps, rockfalls, coincident noise, and false detections), we filtered the events further and used machine learning with a random forest classifier (Breiman, 2001), which was developed in multiple processing steps. Firstly, we calculated the signal-to-noise ratio (SNR) and re-defined all start and end times of the events with a kurtosis picker (Baillard et al., 2014; Hibert et al., 2017), which can identify the picked onset more accurately than the robust STA / LTA picker used in the first step. We then rejected events without a distinct ending where the picker could not identify a sharp decrease in the signal (4813 events; usually humans walking next to the stations, signals with >5 s duration, or high background noise not connected to cracking). We further rejected events where the kurtosis picker did not trigger (1128 events), where the two picking routines identified start times differing more that 1 s (2071 events), and events where the kurtosis-picked event ended before the start of the STA / LTA-pick (12 560 events; usually when there was not one discrete isolated event). The random forest classifier requires a set of features that describe the seismic signal and allow us to separate the different classes. We followed and adapted the approach by Hibert et al. (2017) and calculated a set of 61 statistical values from the waveform, spectral, and pseudo-spectrogram domains. We did this for the station with the highest SNR at each of the remaining 88 920 events: once for the event itself and once for a longer signal, including 3 s buffer before and after the picked signal start and end times. Together with maximum SNR, minimum SNR, mean duration, and the duration difference between the stations per event, we used a total of 124 features as random forest input (see details in the Table S2).
In the first step, we created a training data set by manually classifying 1353 events (205 crack events and 1148 others), looking at the features in the plots described in Dietze et al. (2021). We used a balanced proportion of 80 % of the data for training and validating, implementing a 5-fold cross-validation. We set up a random forest with 500 decision trees, including hyperparameter tuning with random search and 1000 iterations on the minimum size of terminal nodes, with the maximum number of terminal nodes and the number of variables randomly sampled as candidates at each split (see the code at https://doi.org/10.5281/zenodo.10567098, Leinauer, 2024, for details). In the last step, we tested the performance of the classifier with the remaining 20 % unseen data. To avoid a misclassification of seismic crack events, we defined a high true-positive rate of 0.9 by setting the prediction cutoff threshold accordingly. In our case, all events were classified as crack events if the probability according to the prediction model was 17.2 % or higher. This, of course, led to a moderately high number of false-positives (15 %), but the overall model accuracy was 91 %. The receiver-operating characteristic (ROC) curve for the first step of the random forest model is presented in Fig. S7. The best performance was reached using all available features. Using only selected features did not improve the classifier (see the variable importance in Fig. S8).
Finally, we predicted the class of a random 10 % (8765) of the unclassified events using the classifier trained in the first step. We then manually corrected 1428 false positives, leading to the second, larger training data set with 2072 crack events and 8037 others. Using this larger data set, we trained a refined random forest model following the same steps as described above, leading to a smaller false-positive rate of 7 % (see the ROC curve in Fig. S9). The accuracy of the classifier is 94 %, which is comparable to previous studies and in the range of human classifiers (Provost et al., 2017; Hibert et al., 2017; Wenner et al., 2021; Langet and Silverberg, 2023). With this refined model we classified all events, leading to a data set of 21 801 seismic crack events and 67 119 others.
3.2 Snowmelt modelling
We modelled the amount and timing of snowmelt by simulating the dynamic evolution of the snow cover using the one-dimensional open-source software SNOWPACK (Lehning et al., 1999). With meteorological measurements as inputs, SNOWPACK is capable of replicating snow microstructure and layering and its interactions with the surrounding environment. The Bavarian Avalanche Warning Service provided input data, recorded at 10 min intervals. These include incoming and outgoing short-wave radiation, snow depth, relative humidity, air temperature, total precipitation, snow surface temperature, wind speed, and wind direction. Simulations were conducted individually for Zugspitze and Nebelhorn and for each hydrological year from 1 October to 31 September using 15 min time steps. The measured snow depth functioned as a proxy for precipitation inputs, influencing the mass balance. To filter erroneous measurements, the internal MeteoIO pre-processing library was employed. At both stations, we included a constant ground temperature of 0 °C (and, at Nebelhorn, an albedo estimation from short-wave radiation), as these values are not measured at the stations.
The model parameters (see Sect. S2) were adjusted for each simulation to best fit the melting phase, although discrepancies between modelled and measured snow heights remained possible due to model limitations. The main output for this study was the quantity of snowmelt, expressed in kg m−2, which represents the amount of liquid water flowing from the snow cover into the ground. As the Hochvogel is situated between Nebelhorn and Zugsitze (in position and altitude), we used the mean snowmelt of the two sites for further analysis, except for the 2021 melting season, where Nebelhorn data were not available.
3.3 Synoptical time series analysis
To correlate deformation (10 min), rainfall (10 min), snowmelt (1 h), seismic (100 Hz), and temperature (10 min) data, we aggregated all data to hourly values (original data frequency in brackets) and created common time series plots (Figs. 3 and 4). For better comparability we used derived rates for all variables except the temperature data set (e.g. deformation rate, rainfall intensity and snowmelt in mm h−1, crack rate in events per hour, and temperature in °C). Due to the strong instrumental and diurnal noise in combination with partly very low signal rates, we smoothed all curves to uncover the measured process dynamics. We used smoothing window lengths with centred running means between 1.5 and 7 d depending on the SNR and the observed process (see captions of plots for individual values). The use of centred windows implicates the inclusion of future data at any given time, but it smooths the measured data without creating a lag and is applied uniformly to driver and effect. Columns in each sub-plot represent 12 h non-smoothed means.
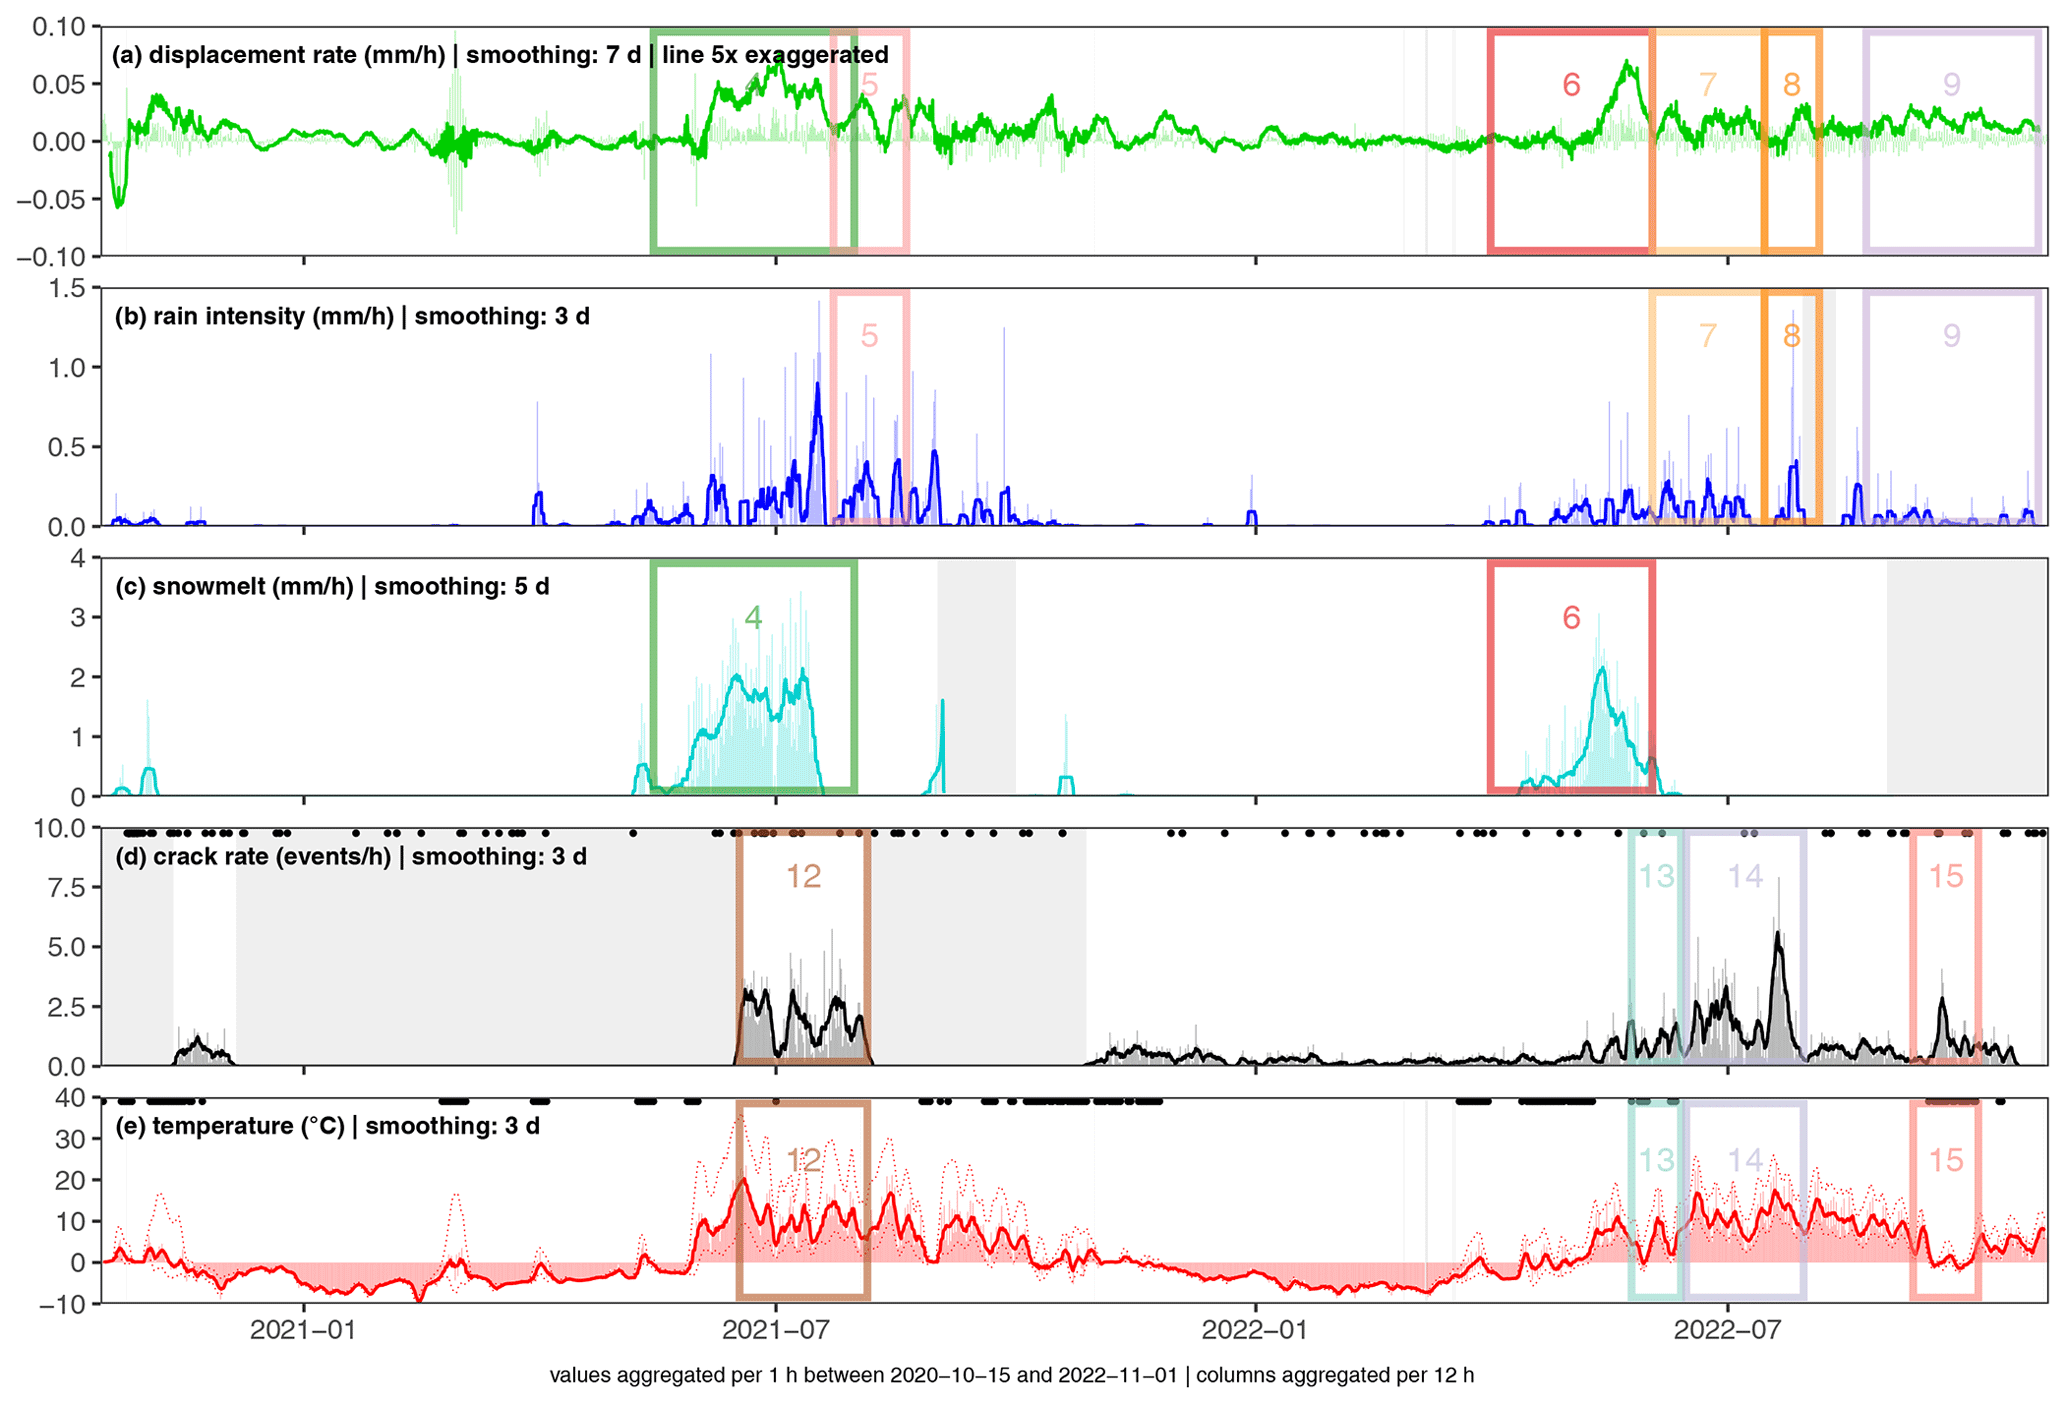
Figure 3Analysed data between October 2020 and November 2022 with marked and numbered focus times (rectangles). Data are aggregated to 1 h resolution (see the degree of smoothing in the headers). Columns give 12 h means. (a) Displacement rate (mm h−1); (b) rain intensity (mm h−1); (c) snowmelt (mm h−1); (d) seismic crack rate (events per hour), where black dots mark the timing of earthquakes from the catalogue; and (e) mean temperature (°C), where dashed lines give minimum and maximum values and black dots mark days with freeze–thaw/thaw–freeze conditions.
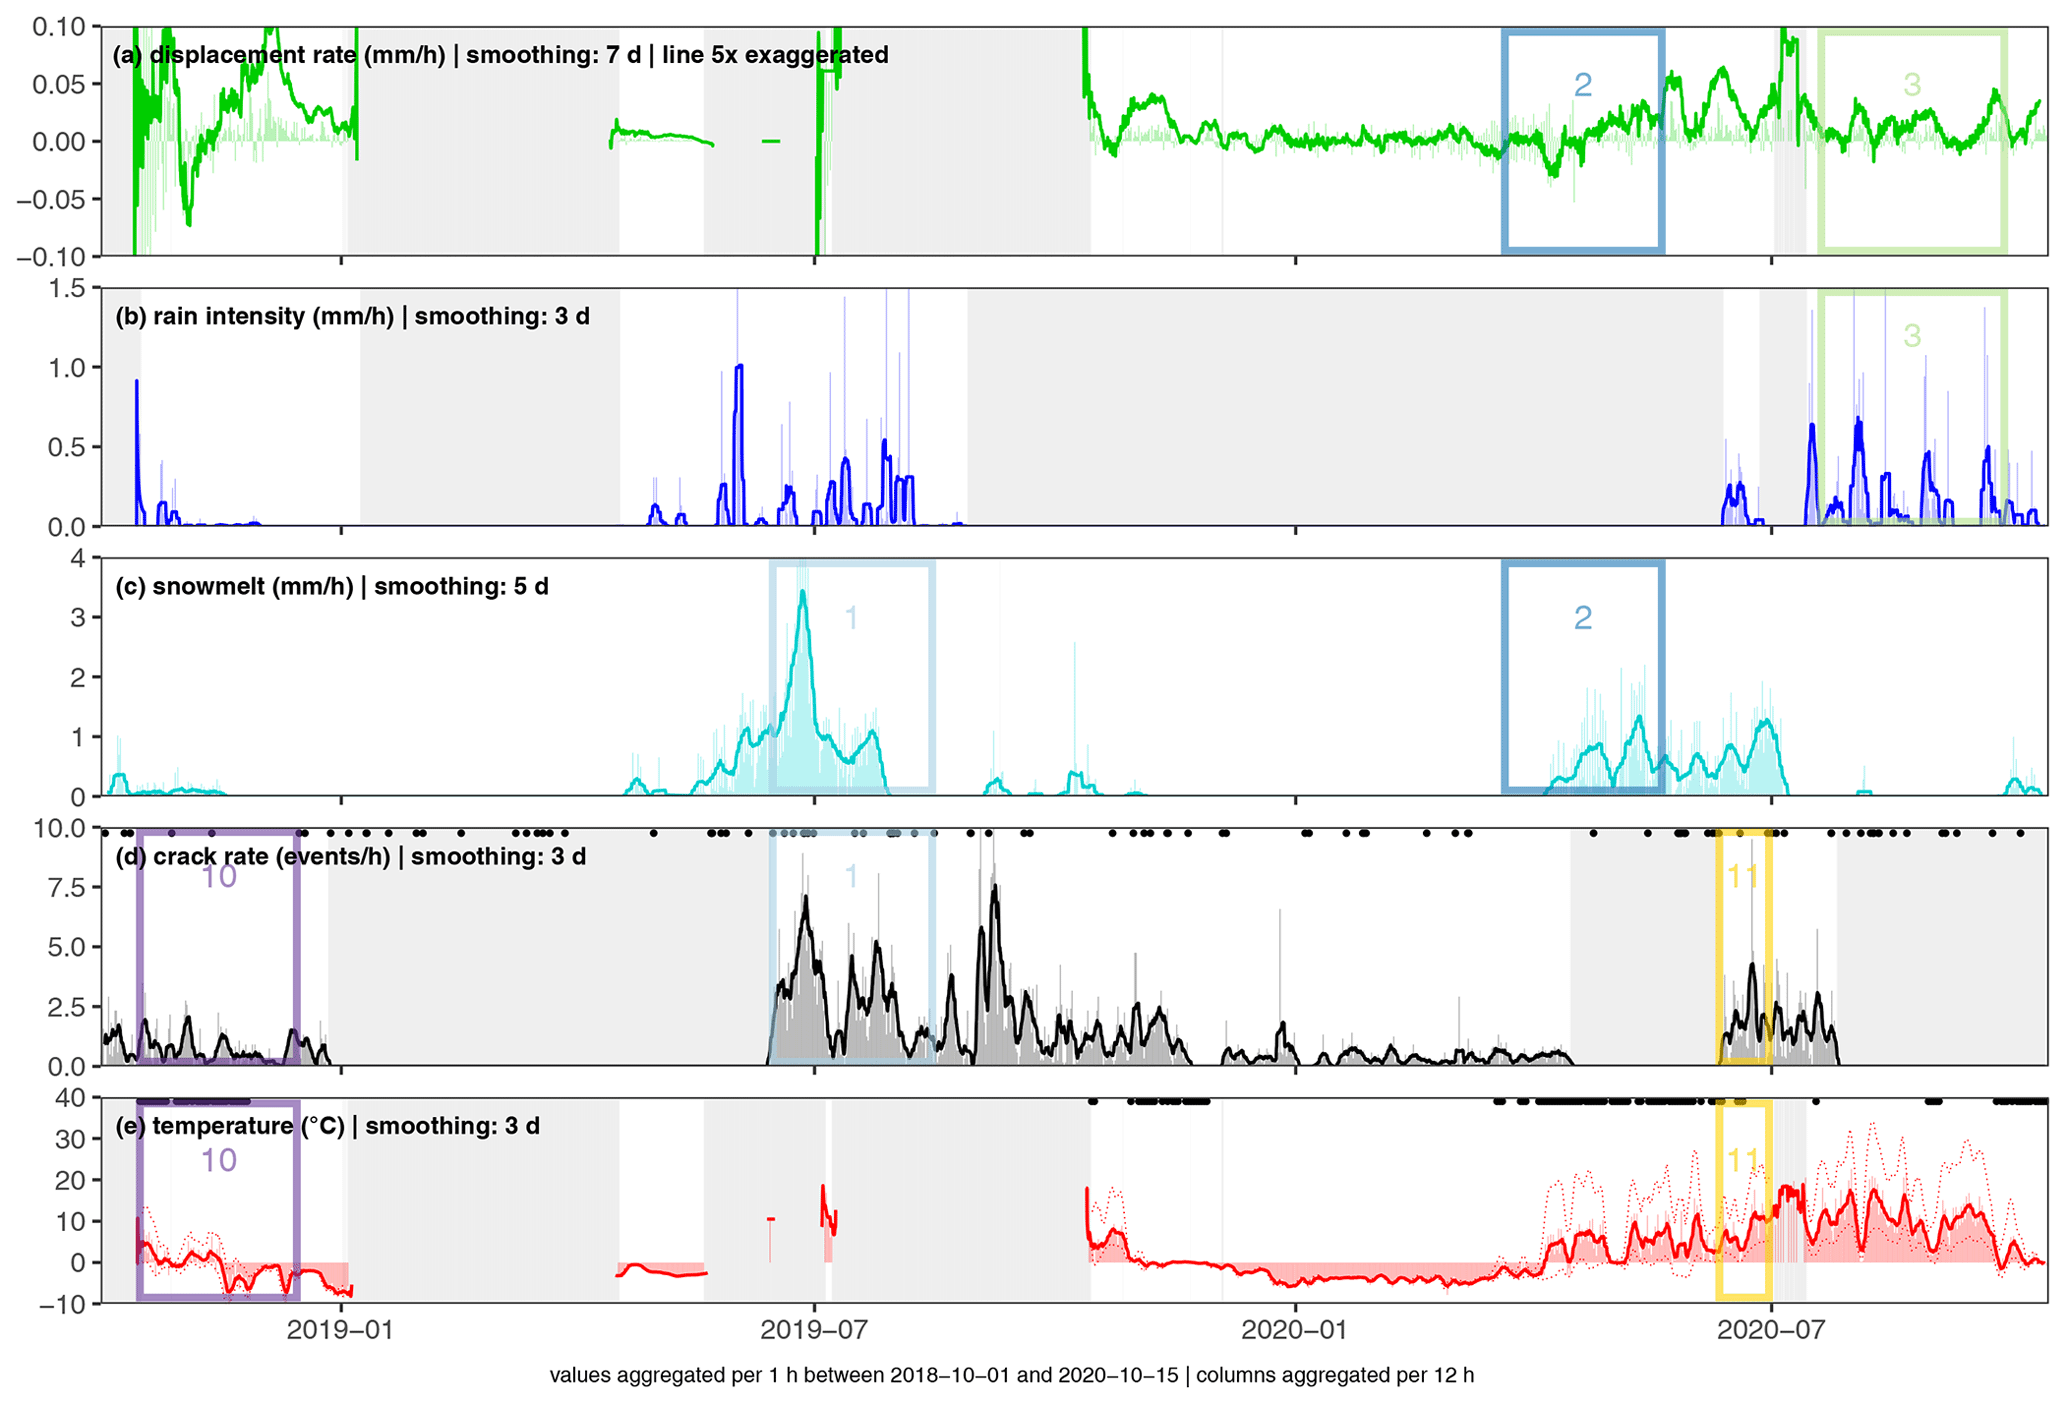
Figure 4Analysed data between October 2018 and October 2020 with marked and numbered focus times (rectangles). Data are aggregated to 1 h resolution (see the degree of smoothing in the headers). Columns give 12 h means. (a) Displacement rate (mm h−1); (b) rain intensity (mm h−1); (c) snowmelt (mm h−1); (d) seismic crack rate (events per hour), where black dots mark the timing of earthquakes from the catalogue; and (e) mean temperature (°C), where dashed lines give minimum and maximum values and black dots mark days with freeze–thaw/thaw–freeze conditions.
Based on an apparent correlation of variable pairs, we have identified three types of proxy behaviour: deformation during rain events, displacements in the snowmelt phase, and thermally driven rock cracking. Within the complete time series, we identified 15 focus time periods highlighting the relationship of the particular variables. For each focus period we performed a detailed analysis (Fig. 5 to 10 and S10 to S18), including a time series plot of the two selected variables to illustrate their correlation (panel a). Mathematically, we tested the correlation via a cross-correlation analysis of the two curves (panel b). Here, we only considered positive time lags between the driver (e.g. rain) and the result (e.g. deformation). For the time lag with the highest correlation coefficient, we then created a scatterplot with accordingly shifted data and fitted a linear least-squares regression (panel c).
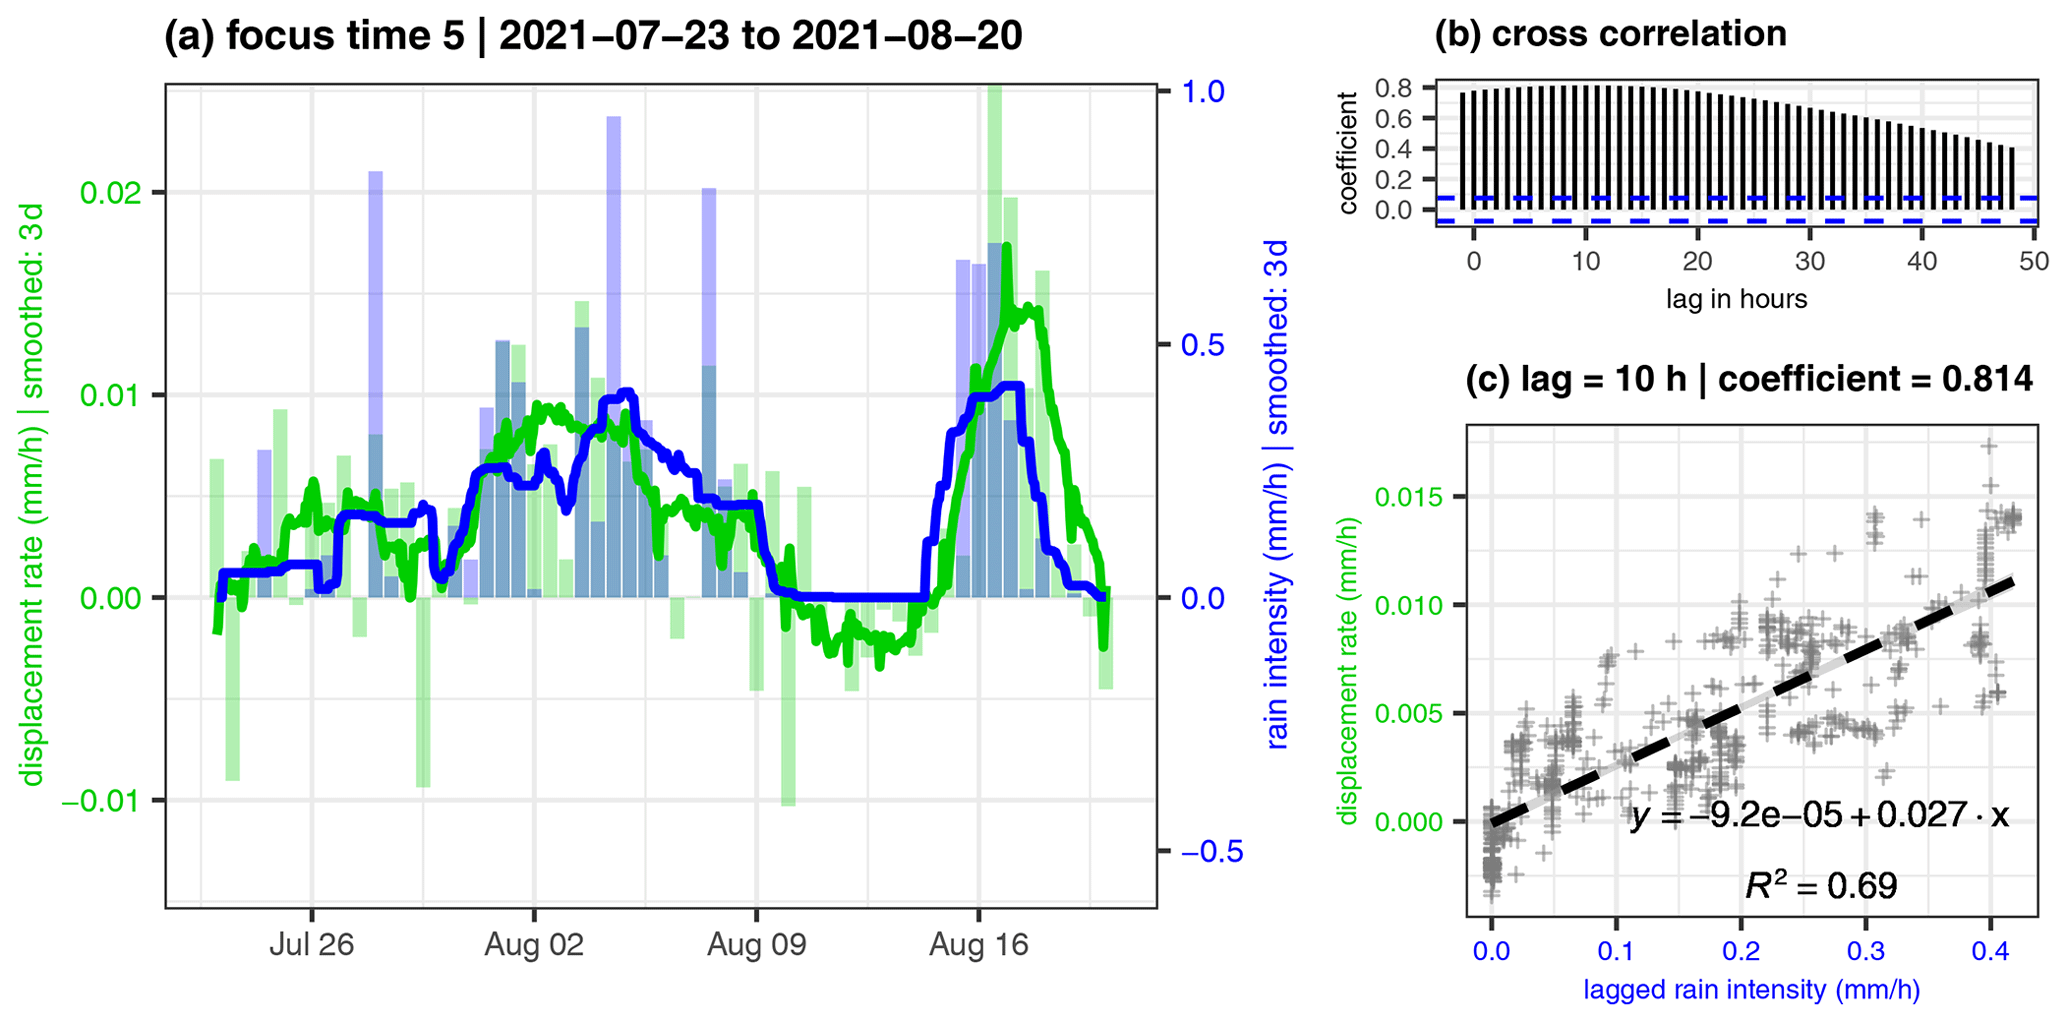
Figure 5Detail plot of focus time 5. (a) Displacement rate and rain intensity (lines 3 d smoothed, columns 12 h means). (b) Cross-correlation coefficient of the two lines. The highest correlation appears with a lag of 10 h and a coefficient of 0.814. (c) Scatterplot with linear trend line (95 % confidence interval as grey area) with 10 h shifted data.
To extend the analysis over the complete available time series, we additionally performed a running cross-correlation analysis. For two selected variables, we calculated the cross-correlation function on a subset of the data with window lengths between 20 and 60 d depending on the observed process. We iterated this by moving the analysis window in 1 d steps and plotted the correlation coefficient for several time lags against the time (Figs. S19 to S25).
3.4 Newmark displacement and topographic amplification
We calculated the Newmark displacement (a theoretical index displacement of slopes during seismic acceleration) using a widely used regression model with the formula for slope failures after Jibson (2007, Eq. 9):
where DN is the Newmark displacement in cm, Ia is the Arias intensity in m s−1, and ac is the critical acceleration in terms of g (the gravity constant). The critical acceleration ac in m s−2 depends on the factor of safety (FOS; ratio of resisting forces over driving forces) of the area of interest and the sliding plane's slope angle α in degrees (Newmark, 1965; Jibson, 1993):
The Arias intensity can be estimated according to the following formula (Wilson and Keefer, 1985; Jibson, 1993):
where M is the earthquake magnitude, D is the epicentre distance in km, and h is the focal depth in km.
The exact FOS at the Hochvogel instability can currently not be determined due to uncertainties in the location and condition of the sliding surface. Due to the ongoing mass movement over many decades (Leinauer et al., 2020), we assume only few remaining rock bridges in the carbonate mass and infer an FOS close to failure of about 1.1 (Knapp et al., 2018; Heckmann et al., 2012). To incorporate uncertainty, we further evaluated a variety of FOS values, where an FOS of 1.05 represents conditions closer to failure, an FOS of 1.2 represents less sensitive conditions, and an FOS of 1.01 represents a slope instability that is imminently failing. We calculated all theoretical Newmark displacements for the set of FOS between 1.01 and 1.2, slope angles between 25 and 85°, magnitudes up to Mw=8, distances up to D=150 km, and a focal depth of h=8 km (mean depth in the earthquake catalogue). We assume a conservative critical Newmark displacement of 2 cm, above which rockslides can be triggered (Miles and Keefer, 2001; Meyenfeld, 2009). In a magnitude–distance plot, this critical displacement appears as line per FOS (for a fixed slope angle, see Fig. 11 and Figs. S28 to S34). To assess the possible effect of typical earthquakes in the Hochvogel region, we filtered the BGR and SED catalogues for all events with epicentre distances of less than 150 km from the Hochvogel and plotted these into the magnitude–distance plot. More distant events are regarded as having no major effect. The 10 events with the biggest Newmark displacements have been assessed further, including the uncertainty contained in Eq. (1) using their exact focal depth (Figs. S35 to S41).
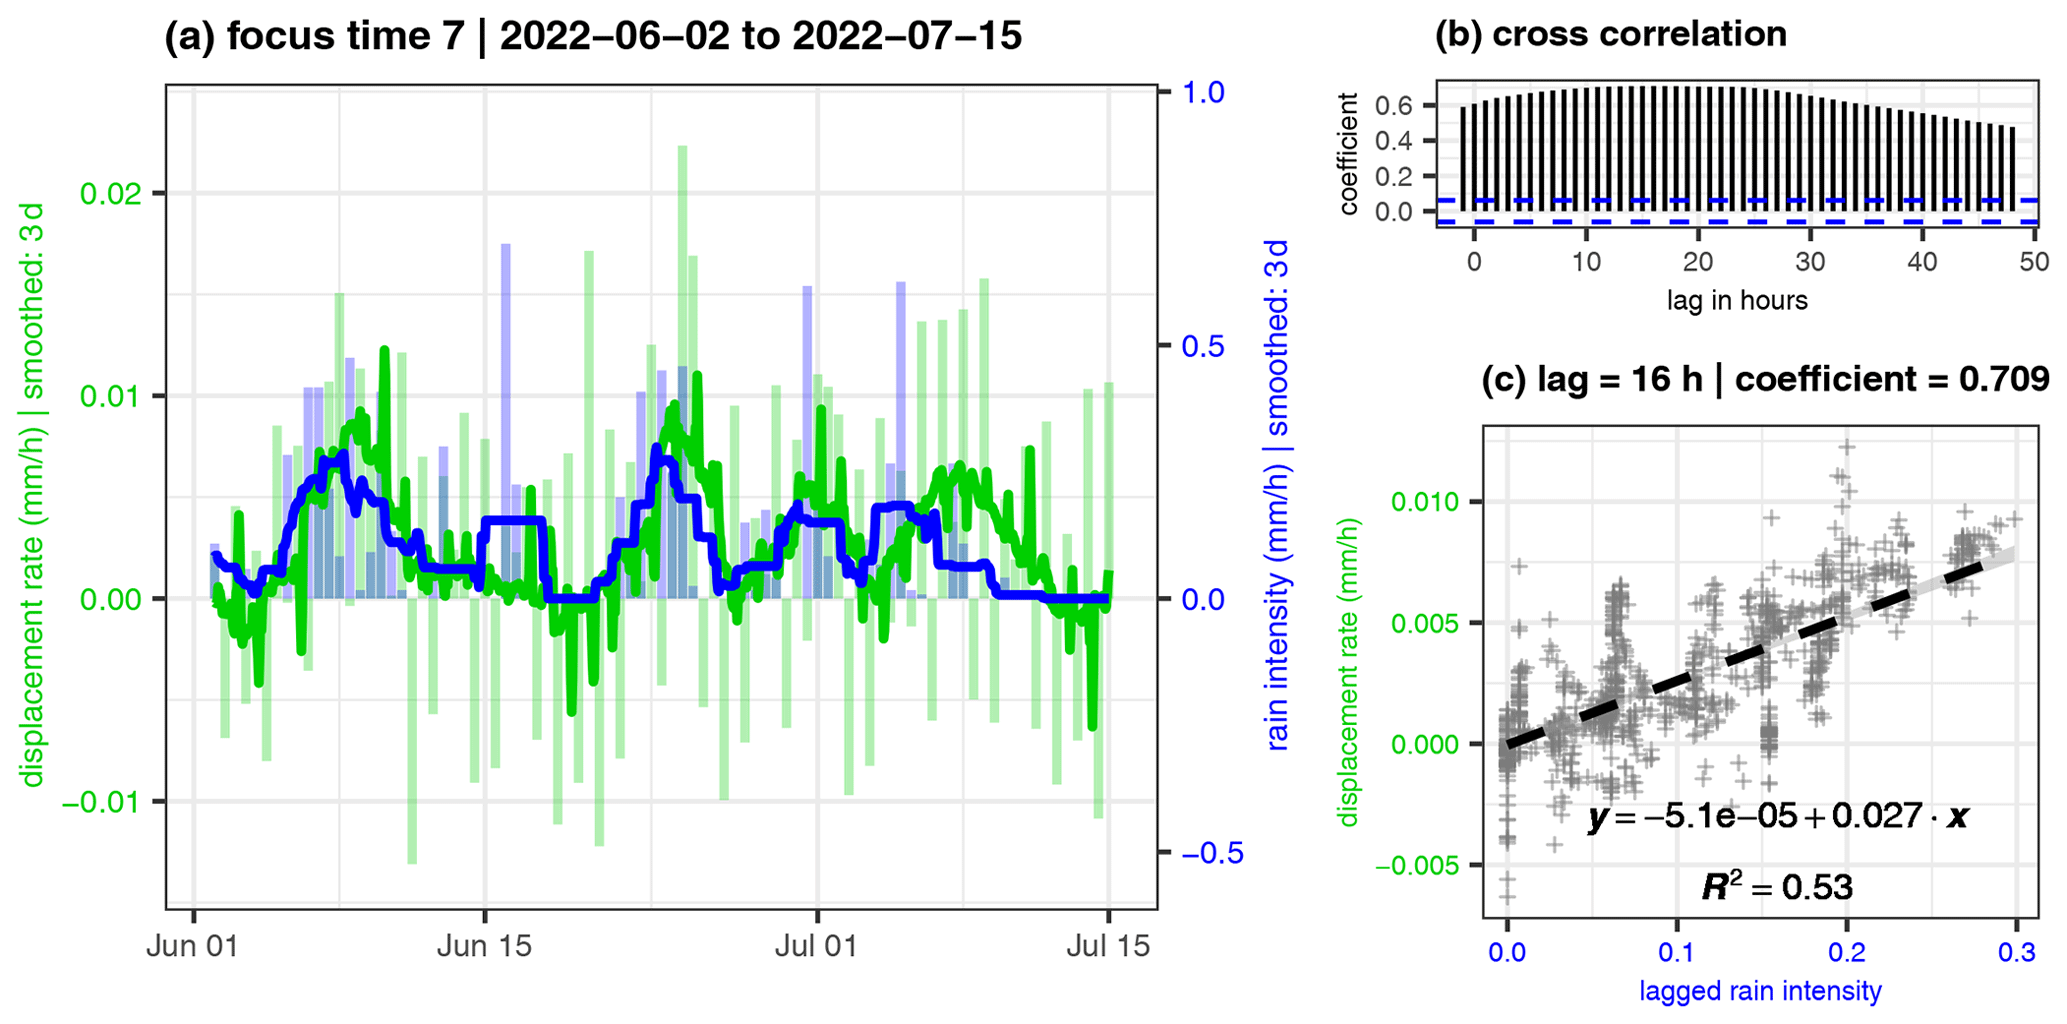
Figure 6Detail plot of focus time 7. (a) Displacement rate and rain intensity (lines 3 d smoothed, columns 12 h means). (b) Cross-correlation coefficient of the two lines. The highest correlation appears with a lag of 16 h and a coefficient of 0.709. (c) Scatterplot with linear trend line (95 % confidence interval as grey area) with 16 h shifted data.
To assess the effect of topographic amplification, we use the peak ground velocity (PGV) measured by our seismometers after several earthquake events (see example record in Fig. S42). It is often complex to distinguish between topographic resonance effects and interacting localized site effects (Rault et al., 2020; Weber et al., 2022), but landslide appearance and rockfall volume correlate with high peak ground accelerations (Meunier et al., 2007; Massey et al., 2022). During earthquakes, the stability of slopes relies on the magnitude of ground motion and its frequency content (e.g. Jibson et al., 2000; Rault et al., 2020). We therefore look at PGV values as the phenomenological result of seismic stimulation measured by our sensors. We compare the measured PGV during earthquakes at the summit station HV1 with the PGV at stations HV2, HV3, and HV5 on the flank lower in the valley and with the PGV at station SA23 on the stable side of the summit. The station HV4 had to be excluded due to the insufficient number of recorded earthquakes. We used all earthquake events from the BGR and SED catalogues that have been recorded on all three components (Z, N, E) of each particular station (Fig. S27). For comparison of regional and distant earthquakes, we additionally used 18 events with a distance D>15 000 km and magnitude Mw>6 from the USGS catalogue. We then detected the PGV in the signal envelope in 1 Hz windows moved in 0.25 Hz steps between 0.5 and 10 Hz for all components, stations, and earthquake events. The ratio of the PGV at station HV1 against the other stations (site-to-reference ratio) is used as an indicator of amplifying effects.
4.1 Rainfall-induced displacement
During the warm summer months after snowmelt (June or July to October), the rock mass shows accelerated movement in connection with strong precipitation events. During this period, 38 % of the total crack opening happens during wet days, although these only account for 26 % of the total time. The average displacement rate is 1.8 times higher during wet periods compared to periods without precipitation. Looking at peak velocities, this effect reaches a factor of 4–5. Determining the significance of the overall rainfall effect is complicated by the superposition of various effects over parts of the time series: (i) rainfall-induced displacements, (ii) simultaneous snowmelt and rainfall, (iii) rainfalls without obvious acceleration, (iv) accelerations without obvious reason, and (v) non-measured precipitation due to the unheated rain gauge. We thus focused on periods where the displacements are clearly induced only by rainfall.
The direct comparison of rainfall intensity and displacement rates during the selected focus times reveals a high correlation with a time lag of 1–16 h (Figs. 5 and 6 and Figs. S10 and S12). In panel (b) in the respective figures, the dashed blue lines give the values beyond which the correlations are significantly different from zero, which is clearly the case for all focus time periods. Without superposition with other effects like snowmelt, this behaviour can be observed in more than 20 rainfall events across the four summers. The lag likely accounts for the rainfall infiltration time and until maximum hydrostatic pressure is built in the discontinuities within the rock mass. Both depend on pre-event saturation, as we cannot observe a consistent change in lag time throughout each season. In addition, the saturation of the discontinuity with water might eliminate the joint cohesion in some discontinuities, lower the joint friction angle especially in the basal marl layers, and reduce the effective normal stress at the sliding surface due to buoyancy (Erismann and Abele, 2001), leading to increased displacement rates.
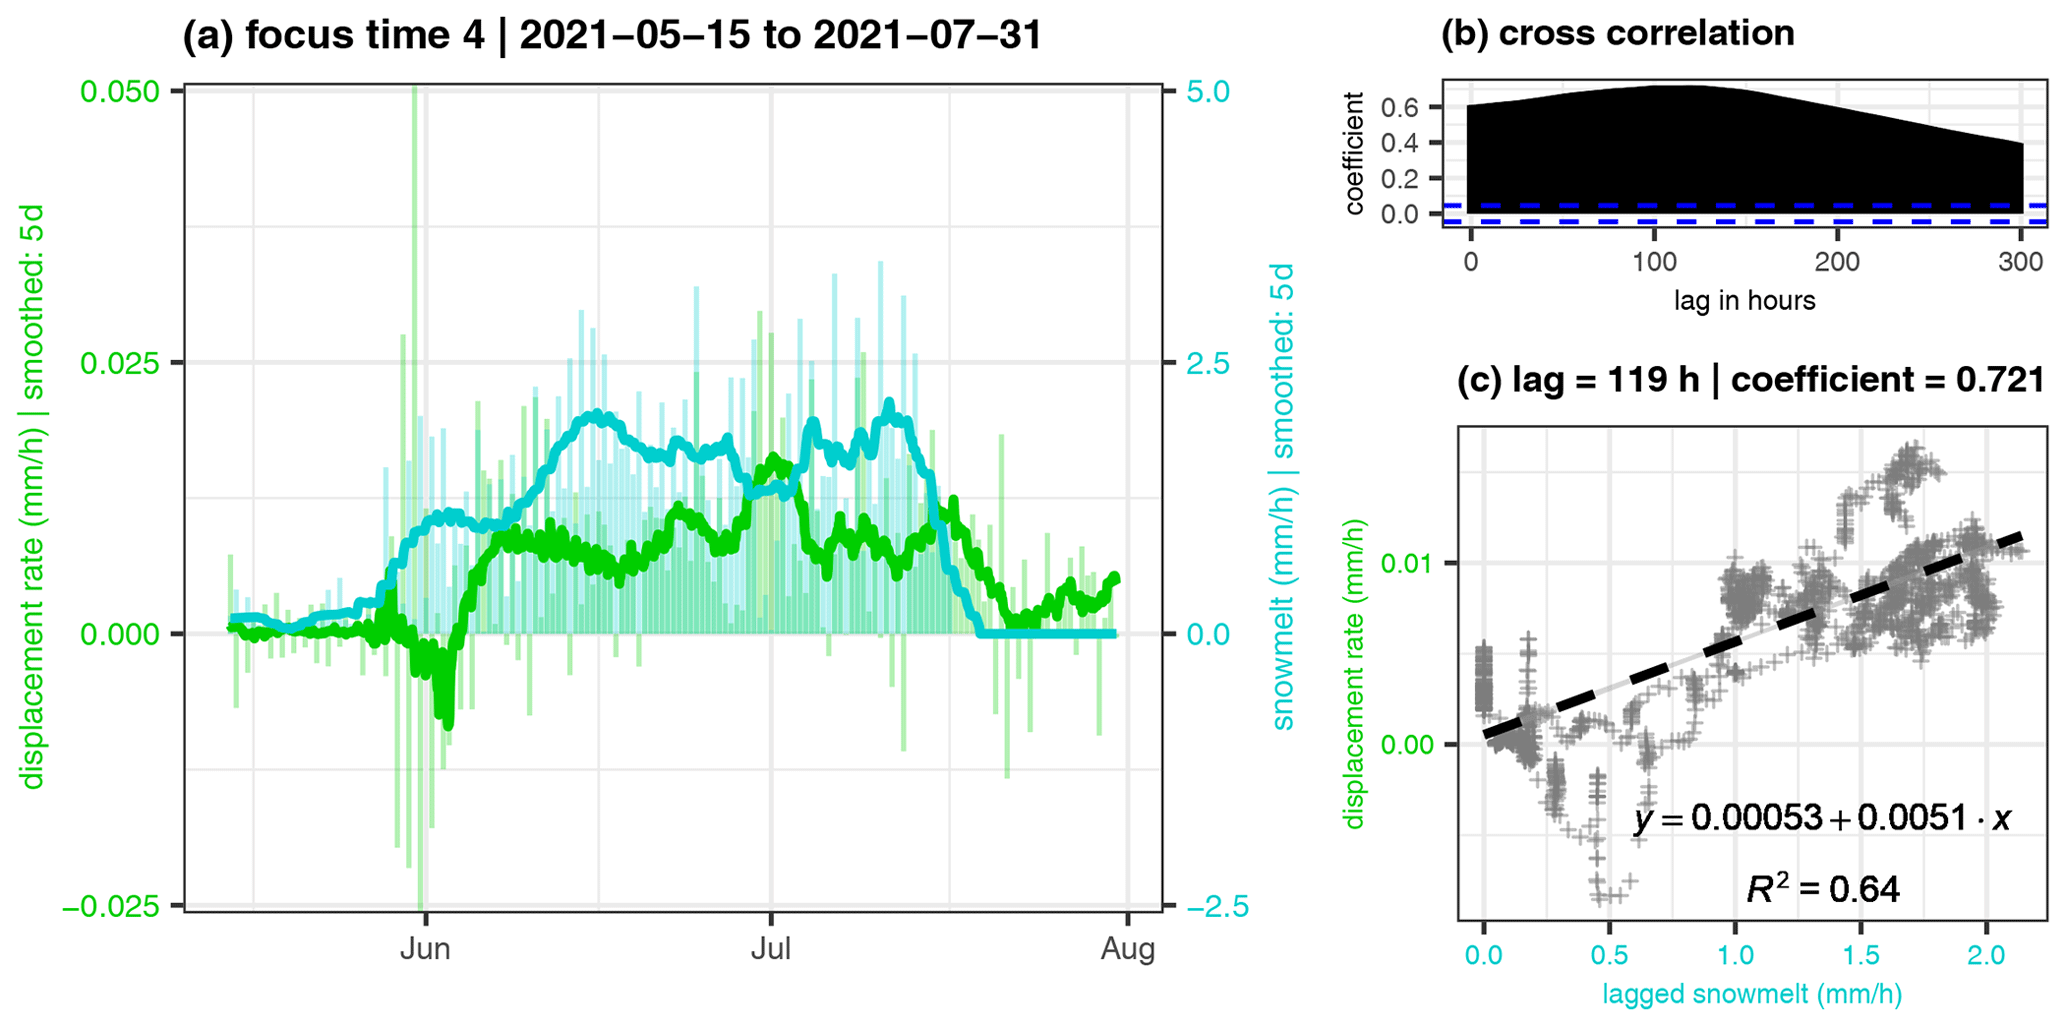
Figure 7Detail plot of focus time 4. (a) Displacement rate and snowmelt (lines 5 d smoothed, columns 12 h means). (b) Cross-correlation coefficient of the two lines. The highest correlation appears with a lag of 5 d and a coefficient of 0.721. (c) Scatterplot with linear trend line (95 % confidence interval as grey area) with 119 h shifted data.
We cannot identify an activation threshold, meaning that even small amounts of rainfall can accelerate the mass movement (see focus time 9, Fig. S12). Within dry periods, timely well-constrained intense rainfall events with several mm h−1 accelerate the mass up to 1 mm d−1 (see 16 August in Fig. 5). When the water input decreases at the end of the rain event, the unstable mass decelerates. There is no permanent sealing of discontinuities, and perched water drains within several hours. On the other hand, rain events that happen close together within few days result in a common velocity peak due to the retention of water in the system (see focus time 8 in Fig. S11). This proposes an immediate lowering of water saturation, at least in the fractures, in cases of dry conditions but also that a proportion of the infiltrated water stays in the system for several days. This can precondition the system in cases of further water infiltration, as partially to fully saturated conditions promote the build-up of hydrostatic pressure. However, an inert reaction of the unstable mass in the form of low velocity changes necessitates relatively long smoothing windows, which might in turn outsmooth short-duration rain events. Then, the 12 h columns help to interpret the process. A good balance between smoothing window length, event duration, and SNR must be found.
From the linear regression between rain and displacement, we infer that, in general, rain intensities of 0.3–0.6 mm h−1 trigger displacement rates of ca. 0.01 mm h−1 at the Hochvogel. The running cross-correlation (Fig. S20) gives high correlation coefficients of >0.75 with small lag times each summer after snowmelt. This supports the interpretation of a rainfall-controlled regime during the snow-free summers. However, the correlation coefficient fluctuates due to the short duration of rain events. The generally strong and immediate response of the rock slope to rain events is indicative of existing substantial damage and a high criticality of the slope (Gischig et al., 2016).
4.2 Snowmelt-induced displacement
Snowmelt usually occurs between April and July and contributes significant amounts of water to the system, causing accelerated slope movements (Figs. 7 and 8 and Fig. S14). While meltwater generally affects slope dynamics the same way as precipitation, our cross-correlation analysis suggests longer lag times, between 4 and 9 d. This is likely related to the slower but therefore more continuous supply of water into the rock mass. Moreover, as there is no snow station directly at Hochvogel, the snowmelt amount is modelled based on measurement data from neighbouring peaks, Nebelhorn and Zugspitze. Given that the south-oriented slopes of the Hochvogel peak become snow-free quite early, while significant amounts of snow remain in the >10 m deep main fracture much longer, we anticipate differences in the snowmelt characteristics.
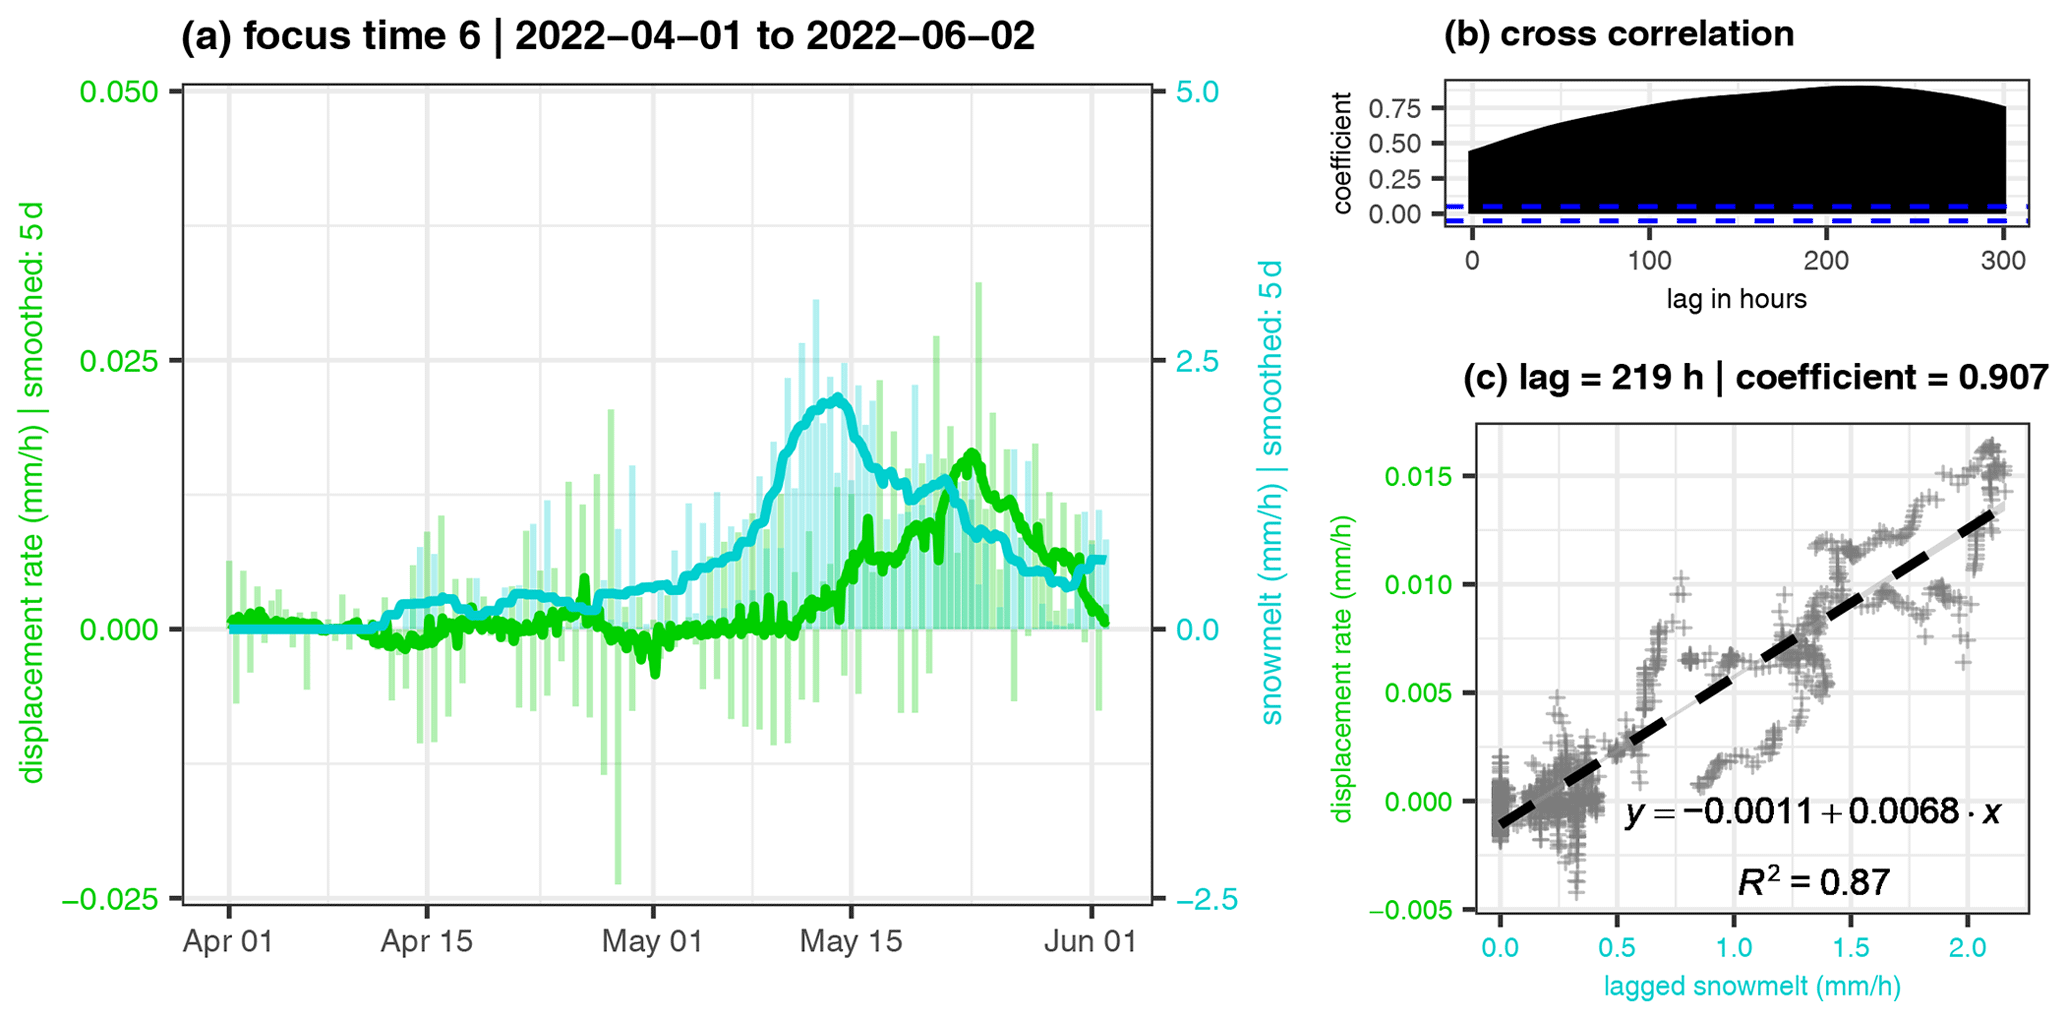
Figure 8Detail plot of focus time 6. (a) Displacement rate and snowmelt (lines 5 d smoothed, columns 12 h means). (b) Cross-correlation coefficient of the two lines. The highest correlation appears with a lag of 9 d and a coefficient of 0.907. (c) Scatterplot with linear trend line (95 % confidence interval as grey area) with 219 h shifted data.
The intensity of the modelled snowmelt generally surpasses the measured rain from the summit, potentially not reflecting the accurate volume of snowmelt infiltrating into the discontinuities at Hochvogel. However, our analysis indicates that, on average, modelled snowmelt of about 1.5 mm h−1 corresponds to displacement rates of ca. 0.01 mm h−1. Secondary peaks with higher snowmelt rates inducing temporary accelerations are visible in the velocity curve, too (e.g. 2–15 July in Fig. 7 and 20 May in Fig. 8). During early summer, intense rainfall from the first thunderstorm cells superimposes with the late snow melting phase, making it challenging to distinguish the driving processes effectively during this period. However, rain falling on snow can result in higher water infiltration than from the rainfall alone (Stock et al., 2013).
The running cross-correlation (Fig. S21) gives correlation coefficients above 0.75 with lag times of 4–9 d each year during snowmelt. This supports our interpretation of a meltwater-controlled regime during the snowmelt season. The snowmelt correlation coefficient fluctuates less than with the rain data, as the snowmelt appears more continuous than the distinct short rain events.
4.3 Seismic crack events
The summit network recorded 21 801 discrete events that fall into the class of rock cracking. Their duration was 1.4 s (median and quartile range), preferentially occurring during the daytime. On an annual scale, the crack rate is higher during the summer months, coinciding with higher displacement rates, higher rainfall intensities, and higher temperatures (Fig. S6). We therefore analysed if rock cracking rates and displacement rates interact directly or if the correlation is rather indirect, meaning that environmental forcing increases both crack rates and slope movement.
We could not find specific time periods where the smoothed crack rate correlates well with the smoothed displacement rate (Figs. 3 and 4). Likewise, the running cross-correlation analysis (Fig. S19) did not reveal stable high correlation coefficients with a specific time lag. This implies that there is no obvious correlation between crack rate and displacement rate.
The same applies for the correlation between crack rate and rainfall intensity (Fig. S23). In the 2019 melting period (focus time 1, Fig. S13), we found a high correlation between 7 d smoothed snowmelt and crack rate at a time lag of 40 h. However, this relation did not emerge in other years, and it remains unclear if strong snowmelt can induce enhanced rock cracking.
In contrast, we found the crack rate peaking during temperature peaks (see Fig. 9 and Figs. S15 and S16), likely related to thermal forcing through volumetric expansion and contraction of the rock mass and its minerals. Even small oscillations are represented in both curves. The maximum correlation coefficient appears with a time lag of 0–15 h. Additionally, we observed peaks of rock cracking activity during days with freeze–thaw and/or thaw–freeze conditions (Fig. 10 and Figs. S17 and S18). Furthermore, the first deep frost of the season without thawing conditions seems to enhance the crack event rate for 4–5 d (e.g. 16 November and 11 December 2018, Fig. S17). Here, stress is caused by cryogenic processes in ice-filled fractures or pores, volumetric expansion/contraction, and/or ice segregation (Weber et al., 2017).
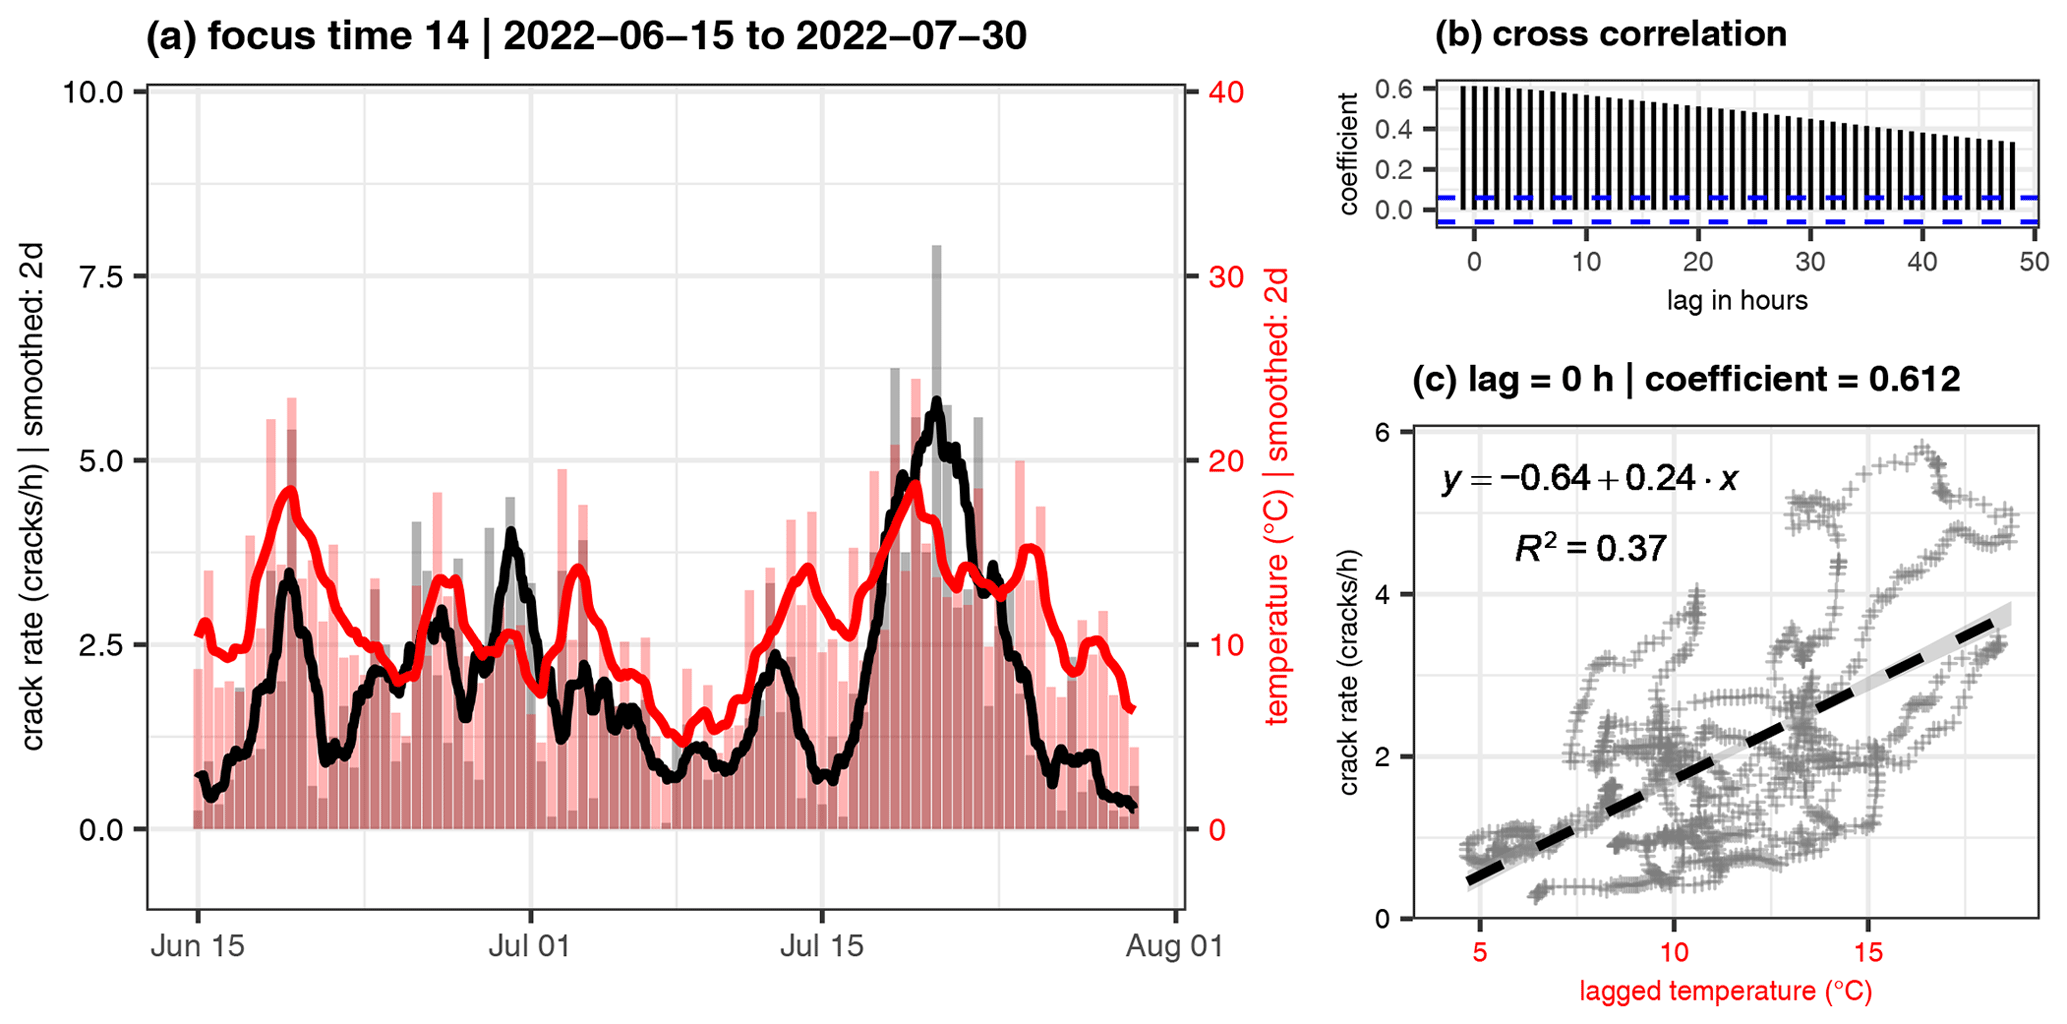
Figure 9Detail plot of focus time 14. (a) Crack rate and mean temperature (lines 2 d smoothed, columns 12 h means). (b) Cross-correlation coefficient of the two lines. The highest correlation appears without any lag and a coefficient of 0.612. (c) Scatterplot with linear trend line (95 % confidence interval as grey area) with data not shifted (0 h).
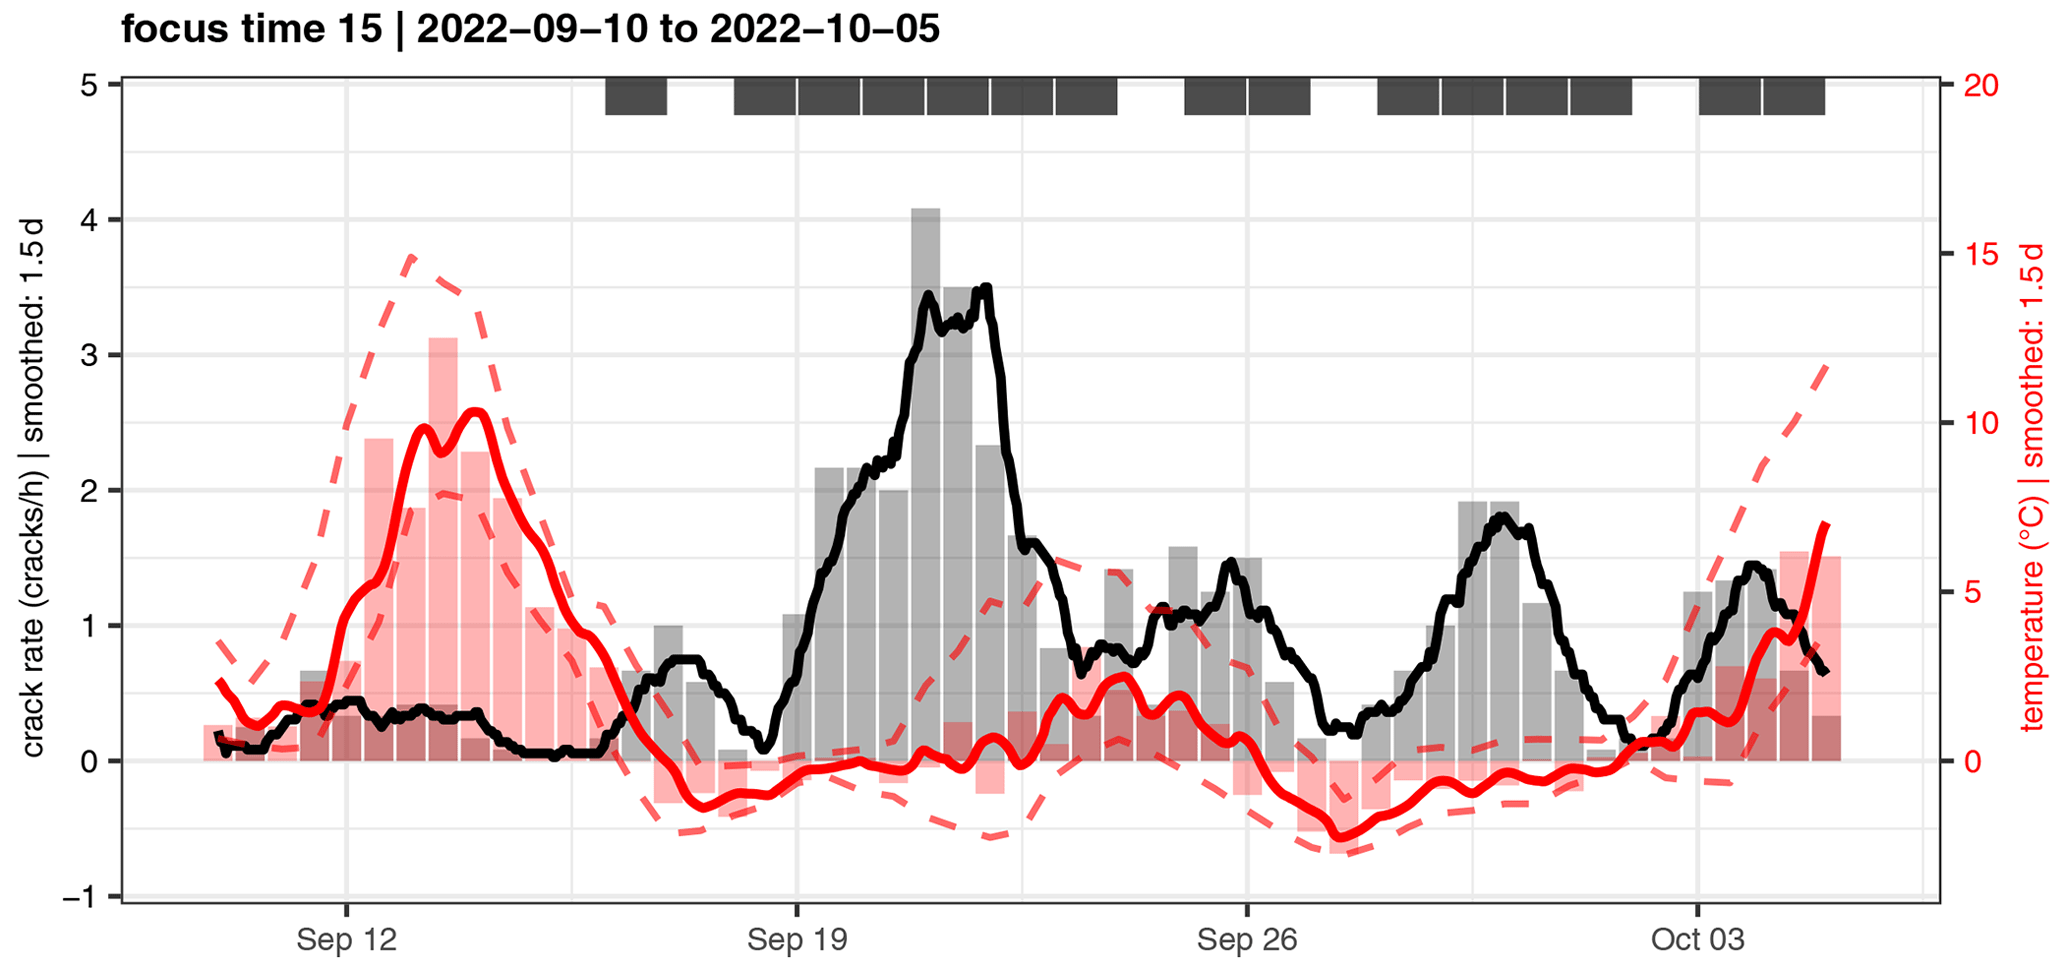
Figure 10Detail plot of focus time 5. Crack rate, mean temperature (solid line), minimum and maximum temperature (dashed lines; all lines 1.5 d smoothed, columns 12 h means). Peaks in the crack rate coincide with days with freeze–thaw or thaw–freeze conditions (black bars on top). The cross-correlation is not shown due to the missing correlation of both curves.
Heat conduction in rock is relatively slow in the range of 1 cm h−1 (Weber et al., 2017; Mulas et al., 2020). The fast reaction of rock cracking activity towards air temperature changes means in turn that most of the crack events that we detected happened close to the surface. This is in line with the results of Dietze et al. (2021). The thermally induced stress can only affect near-surface rock mass (Bakun-Mazor et al., 2013), unless advective heat transport by percolating water or air can act in fractures (Blikra and Christiansen, 2014; Weber et al., 2017). The shallowness of the detected fracturing events can explain why there is no obvious correlation between crack and displacement rates. Displacements can only result from cracking if rock bridges fail at the sliding plane, which we expect to be >10 m away from the rock surface. We assume that we also detected rock fracturing originating from the sliding plane, but the frequency of those events is obscured by the dominant near-surface crack events. Lagarde et al. (2023) state that crack signals might not always be intense enough to distinguish them from other ambient seismic noise. However, this likely changes when the instability develops closer to failure and when the rock fracturing frequency and intensity at the active sliding surface increase. More pronounced rock deformation in the final stage of failure will concurrently intensify the shallow cracking activity. As this activity is then less dependent on temperature changes, it might still be possible to detect a precursory change in activity. On the other hand, crack rates could be altered imminently before failure, when no rock bridges are left (Lagarde et al., 2023), yet it remains unclear if this can be observed at a multi-block rockslide on a mountain the size of the Hochvogel.
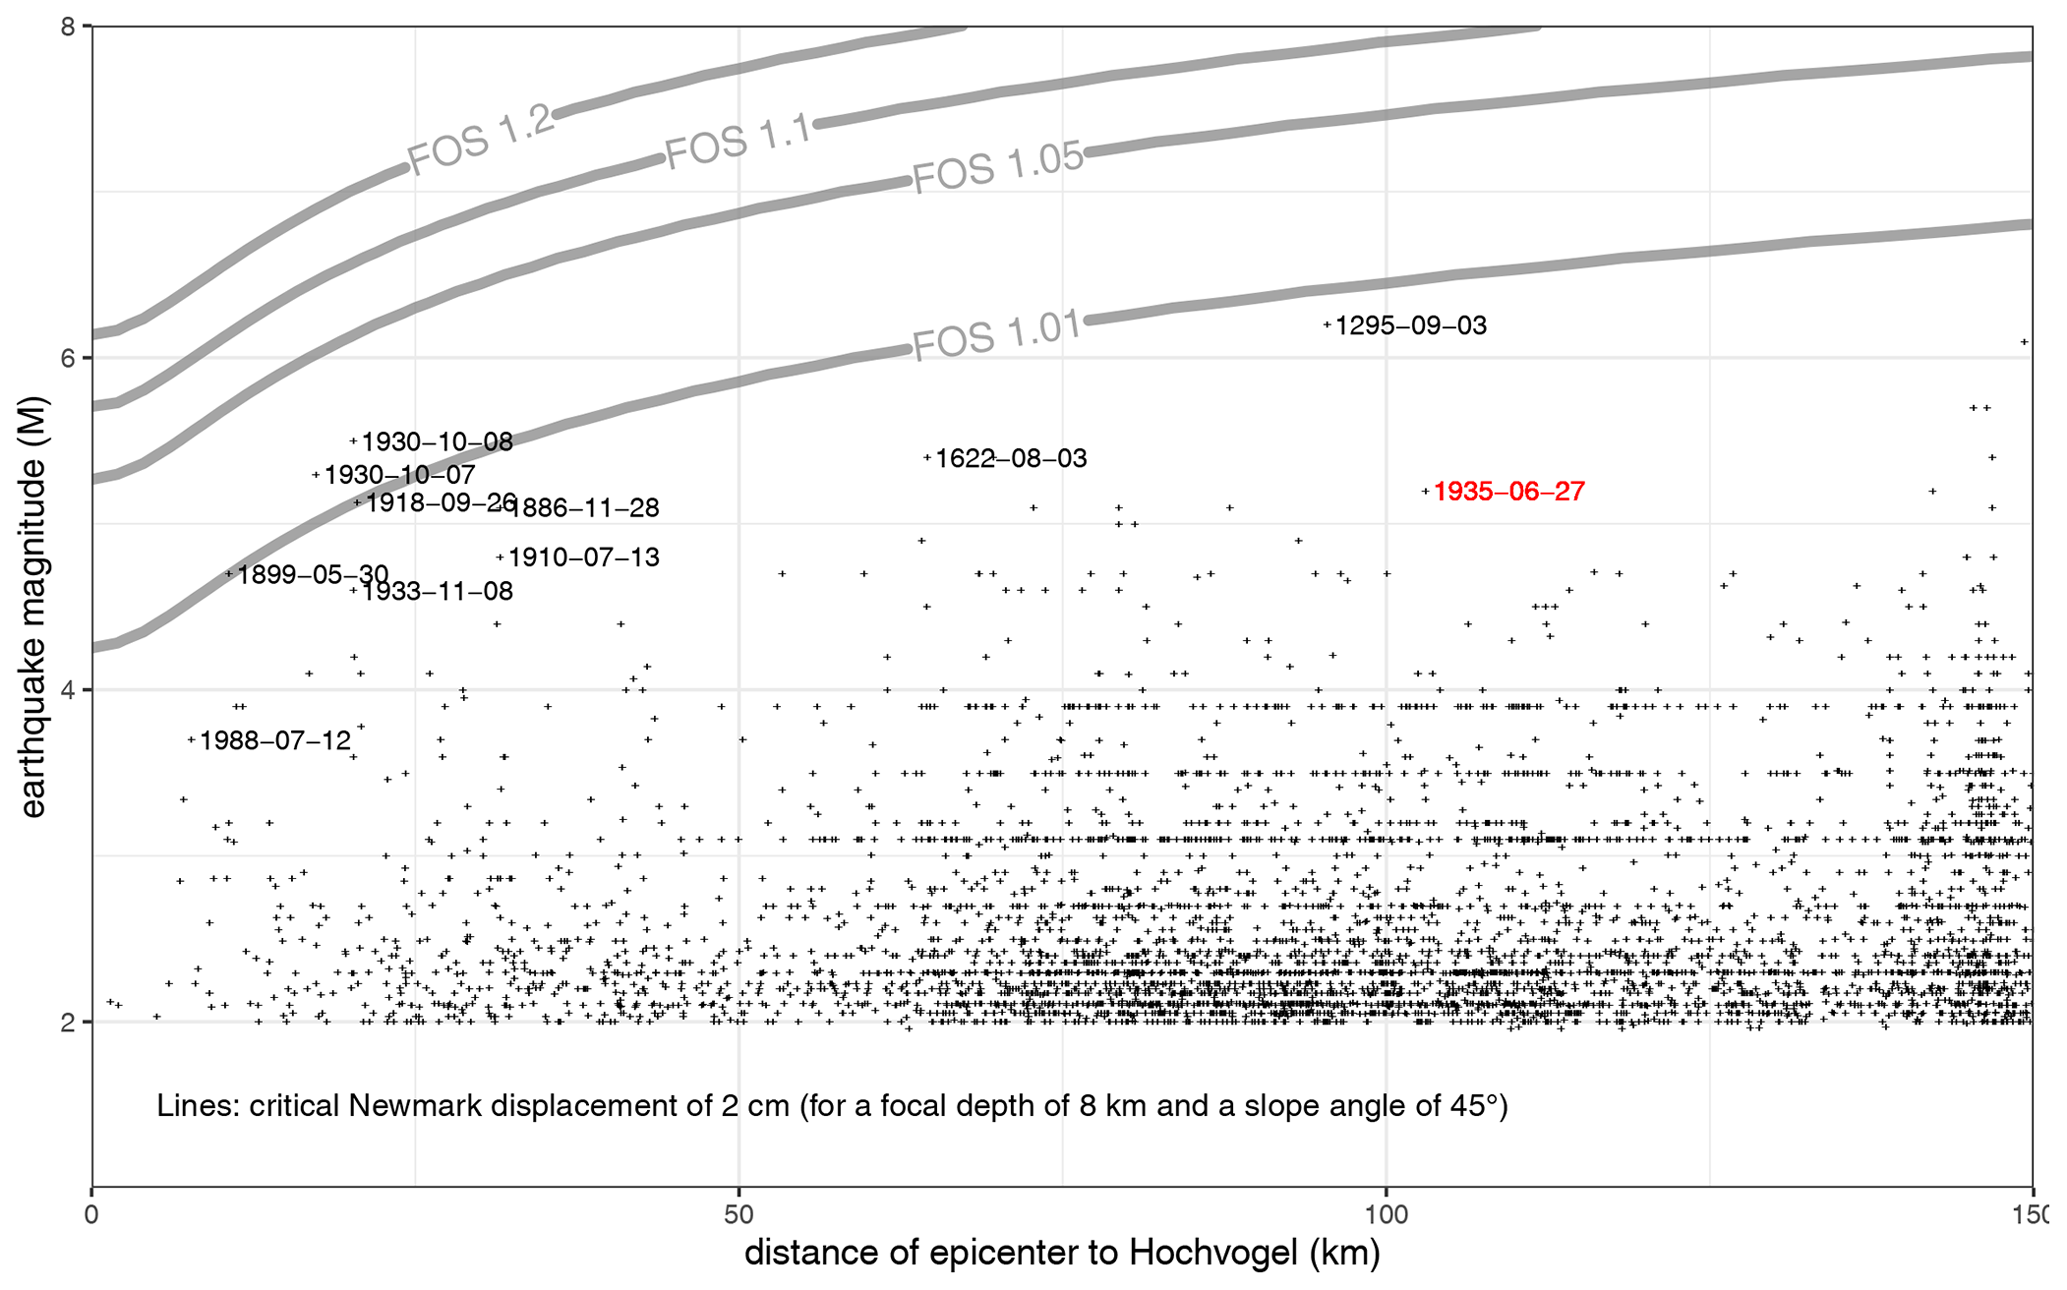
Figure 11Lines indicate different factors of safety at which magnitude and distance of an earthquake a theoretical Newmark displacement of 2 cm is expected. This calculation is based on the mean focal depth of 8 km and the mean slope angle of the Hochvogel SW flank (45°). All earthquakes from the catalogues are plotted with black crosses. The earthquakes with the 10 biggest Newmark displacements are labelled in black with their dates. The 1935 Bad Saulgau event is labelled in red. Plots for all other slope angles are in the Supplement.
4.4 The effect of earthquakes and topographic amplification
The analysis of the earthquake catalogue yielded coincidence of a major earthquake with a major rockfall at the Hochvogel in one case only, on 30 June 1935, 3 d after a M 5.2 earthquake in Bad Saulgau at a distance of 103 km (Hutter, 2010). Potentially, several historical rockfalls at the Hochvogel might not be documented. An event-specific analysis is therefore not productive; thus we included the whole available earthquake database in our analysis (Fig. S26). It shows that low-energy background activity is present, mainly originating in the tectonically active alpine valleys, but close high-magnitude events are rare (only 2 events > Mw 5.5 since 1900). This frequent seismic activity could contribute to a low-level promotion of slope instabilities through seismic fatigue. Gischig et al. (2016) showed that earthquake-induced displacements can vary by more than 2 orders of magnitude depending on pre-existing damage. However, they used a model with several events of magnitudes > Mw 5.7 and shorter distance. For the Hochvogel, a direct comparison of earthquake timings (black dots in Figs. 4d and 3d) with crack or deformation rates did not show obvious significant influence.
To evaluate the potential of earthquakes in the Hochvogel region to immediately trigger a major rockfall event, we conducted a Newmark analysis. The calculation of all theoretical Newmark displacements in the magnitude–distance plot (Fig. 11) illustrates how strong an earthquake must be at what distance to have the potential to trigger a rockslide. From the >5000 historical earthquakes in the database, only very few events are in the range of having triggering potential for very low FOS < 1.03. A further analysis of the 10 events from the catalogue with the biggest Newmark displacements, including the uncertainty contained in Eq. (1), confirms this implication (Figs. S35 to S41). Thus, typical earthquakes around the Hochvogel (e.g. Mw 5 at 20 km distance or Mw 6 at 100 km distance) might only be able to trigger a major rockfall if the unstable mass is already very close to failure (FOS around 1.01). As we interpret the current FOS to be between 1.05 and 1.1, only an exceptionally strong earthquake (e.g. Mw 6 at 15 km distance or Mw 7 at 50 km distance) could immediately trigger a major failure. Recurrence intervals for such events in this area are estimated to vary between 1000 and 2000 years (Oswald et al., 2022). The previously identified 1935 Bad Saulgau event was too weak to have a clear triggering potential. The biggest, but still very moderate, displacement is indicated by the historic 1930 Namlos earthquake (Mw 5.3–5.5, 20 km distance). This event induced enhanced mass-wasting processes recorded in local lakes (Oswald et al., 2022) but did not trigger any high-magnitude slope failures (Oswald et al., 2021).
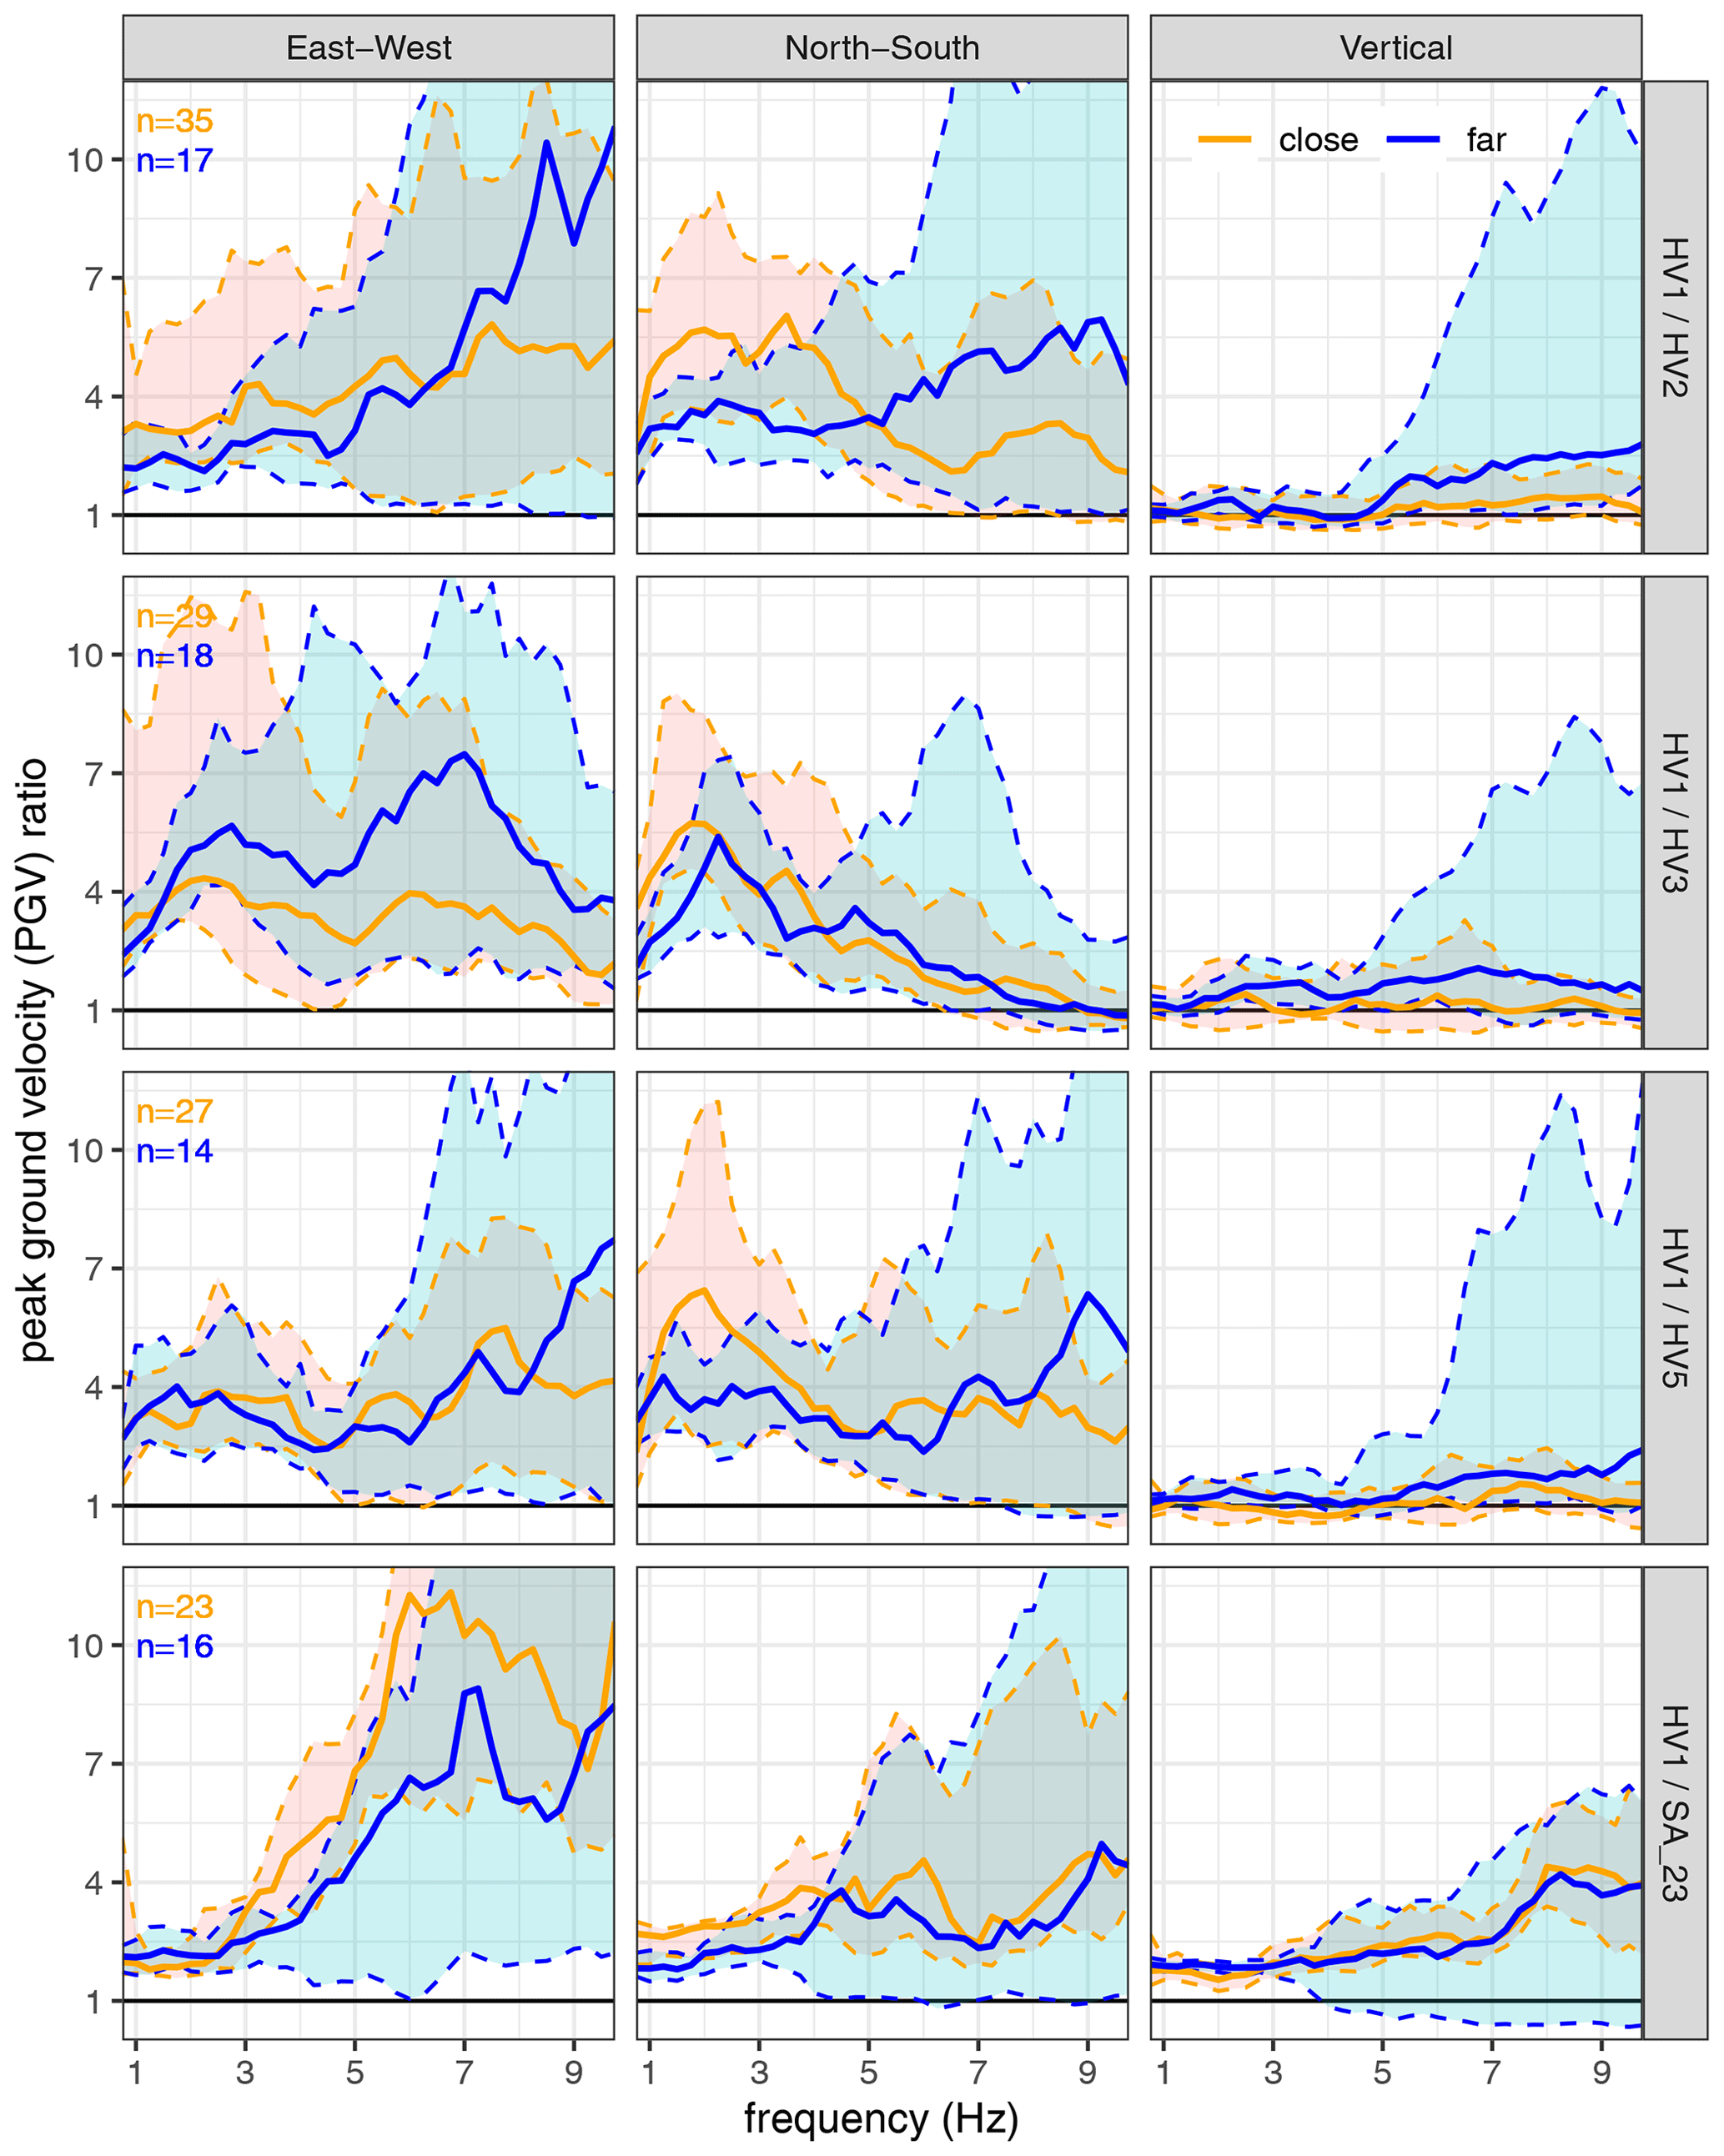
Figure 12Ratio of measured peak ground velocity (PGV) of HV1 on the unstable side at the summit against other stations for close (<150 km, orange) and far (>15 000 km and M>6, blue) earthquakes. The solid line marks the median, and the dashed lines mark the 10th and 90th percentiles. HV2, HV3, and HV5 are located further down the flank, and SA23 is located on the stable side of the summit.
The evaluation of low earthquake-triggering potential holds, although we used a conservative threshold for the critical Newmark displacement of 2 cm. Other studies suggested even higher thresholds between 2–15 cm (Wilson and Keefer, 1985; Jibson et al., 2000; Miles and Keefer, 2001; Meyenfeld, 2009). Additionally, we checked the regression estimate of the Arias intensity with earthquake signals that could be recorded with our local stations. In these cases, Eq. (3) according to Wilson and Keefer (1985) overestimates the Arias intensity by about 1–2 magnitudes compared to the direct determination of Arias (1970) with the measured ground motion values from our stations. Still, the calculated Newmark displacements are below the threshold.
However, this evaluation could change under the influence of topographic amplification. The geomorphological shape of the Hochvogel massif and the location of the unstable mass at the ridge generally favour the effect of topographic amplification (Meunier et al., 2008; Lee et al., 2009a; Khan et al., 2020; Rault et al., 2020). A comparison of the measured peak ground velocity (PGV) during earthquakes at the summit station HV1 against the lower stations shows up to 11 times higher median PGVs at the summit (mean = 3.2, Fig. 12). The extent of this effect varies between the horizontal (Emean=4.5, Nmean=3.4) and vertical components (Zmean=1.7), which is typical for topographic amplification (e.g. Bakun-Mazor et al., 2013; Burjánek et al., 2012; Weber et al., 2022), but it remains consistent across the various stations at the valley flank. The horizontal components show the first low-frequency amplification factor peak between 1.5–3 Hz, which is probably around the fundamental resonance frequency of the Hochvogel. Weber et al. (2022) determined a fundamental frequency of 1.8 Hz for the Grosser Mythen, a mountain of comparable shape and similar scale. The amplification effect at the Hochvogel is least pronounced when referencing the highest valley station HV5 (1933 m), which is situated on a ridge (mean of E-component medians: HV2=4.5, HV3=4.2, HV5=3.8). This is in line with the results of Weber et al. (2022), who measured a mean amplification factor of 9 at the Matterhorn summit and 5 at a ridge below. In general, there is no major difference in median PGV ratios between the local and the far earthquakes. A directional analysis of earthquake epicentres is not yet meaningful due to the limited number of recorded earthquakes.
This could indicate that the summit experiences a significant amplification of factor 2–11 due to topographic site effects and resonant amplification. Then, true displacements due to earthquakes are higher than predicted by the theoretical Newmark displacement analysis; thus the triggering potential is higher than previously assumed. Likewise, the importance of seismic fatigue as a promoting driver is increased by topographic amplification. However, PGV ratios are greater at station SA23, too, which is very close to HV1 but on the stable side of the summit. The general theory would expect a similar amplification at the two summit stations and thus a ratio close to 1. In the low frequencies < 4 Hz, there is no amplification peak at station SA23, other than at the other stations further down the valley flank. This could be a result of similar site effects at the two summit stations, but, still, higher PGVs have been recorded at the HV1 station. This might be due to an amplification and polarization within the unstable rock mass itself due to the open main and lateral cracks (Gischig et al., 2016). Burjánek et al. (2010, 2012) measured similar amplification factors with strong variations in the slope scale on two slope instabilities. It is possible that the unstable mass of the rock slope instability close to the wide open and deep main fracture reacts more strongly to ground motions than the intact bedrock on the stable side of the summit does. As we set up all stations the same way, we assume that all stations have a comparable coupling to the ground. Hence, any differences are assumed to be due to different material properties below the stations, e.g. a massive rock block at the summit and a weathered layer further down the flank. However, large amplification factors and a strong spatial heterogeneity across the instability due to polarization at fractures may indicate a high criticality of the slope (Gischig et al., 2016). If the seismic amplification and its heterogeneity increase in future monitoring, this could be used as a precursory sign of imminent failure.
4.5 Comparative analysis and broader implications
At the Hochvogel, we could analyse the role of multiple drivers and triggers in a comprehensive approach based on continuous real-time data. Previous studies have done this based on either historic event catalogues (e.g. Stock et al., 2013) or smaller-scale rockfalls (e.g. Dietze et al., 2017b). Others investigated aspects of specific drivers at different case sites that can be compared to the Hochvogel.
The importance of rainwater as a fundamental driver and trigger is unquestioned (e.g. Guzzetti, 2021; Scandroglio et al., 2021). For example, at Veslemannen in Norway, Kristensen et al. (2021) detected accelerations in a 54 000 m3 slope instability in metamorphic rock that are linked to heavy precipitation events. There, peak velocities appeared 2–24 h after precipitation peaks, similar to the time lags at Hochvogel. However, during each seasonal cycle at Veslemannen, the reaction of the unstable mass to water infiltration was strongest in autumn, probably due to long-lasting frozen ground conditions that hindered the water in reaching the sliding plane. In contrast, the main acceleration phase of instabilities in warmer regions of southern and central Europe mainly appears in spring or summer due to less deep seasonal frost. The exact timing of the acceleration phase seems to depend on the amount of snowmelt and the timing of the rainy season, but the general pattern is similar among various sites, e.g. the 8×10⁶ m3 La Saxe rockslide (Crosta et al., 2014) and the 20×106 m3 Ruinon rockslide (Crosta and Agliardi, 2003) in Italy or the 3.5×10⁵ m3 Preonzo rockslide in Switzerland (Loew et al., 2017). Another study with high temporal resolution was carried out at the Séchilienne rockslide in the French Alps, where Helmstetter and Garambois (2010) also found no minimum rain threshold for rockfall triggering. They report time lags of up to 1 h for rockfalls and a few days for the acceleration of the deep-seated landslide. However, there, accelerated movements lasted for about 1 month, which might be connected to the bigger size and deeper-seated sliding zone compared to the Hochvogel (50–100 million m3 vs. 200 000–400 000 m3).
The driving force of snowmelt has been considered, especially in snow-rich countries like Japan (Kawagoe et al., 2009) or Norway (Kristensen et al., 2021). For example, Norway has set up a forecasting and warning service for rainfall- and snowmelt-induced landslides, although this seems to refer mainly to debris and soil mass movements (Krøgli et al., 2018). At Veslemannen, smaller snowmelt events in autumn triggered stronger accelerations than rapid snowmelt did in spring (Kristensen et al., 2021). This underlines that a detailed analysis of the exact timing and processual response of rock slope instabilities to snowmelt must be considered. The analysis of the Hochvogel data thus adds valuable insights into the slope response towards snowmelt for alpine sites with seasonal snow cover.
The analysis of the driving role of temperature changes at the Hochvogel revealed no direct impact on displacement rates but a strong control on near-surface cracking. This is due to the limited penetration depth of temperature changes on a daily or seasonal scale relative to the depth of the sliding plane. Similar near-surface effects concerning irreversible displacements or rock fracturing have also been reported by other studies (Bakun-Mazor et al., 2013; Weber et al., 2017; Mulas et al., 2020; Dietze et al., 2021). The only effective way to affect deeper-seated sliding planes seems to be advective heat transport by percolating water or air in fractures (Blikra and Christiansen, 2014; Weber et al., 2017). However, thermal control of displacement rates is likely most important in permafrost slopes (e.g. Mamot et al., 2021).
The local seismicity has a low triggering potential at the Hochvogel rock slope instability. However, other regions receive stronger seismic loading with frequent earthquake-triggered landslides (e.g. Meunier et al., 2007; Massey et al., 2022), and the seismic control varies among different rock slopes. Thus, the effect must always be evaluated site-specifically. This is achieved with the presented methodological approach of critical Newmark displacement lines per FOS in a magnitude–distance plot (Fig. 11). These lines are independent of site-specific parameters; thus, the local variations in the slope angle and typical earthquakes are key to judging the topographic site effects. The identified local amplification factors and patterns at the Hochvogel are similar to those reported on other sites in Switzerland (Burjánek et al., 2010, 2012; Weber et al., 2022), potentially supporting a general pattern. However, the study of Rault et al. (2020) found a complex response of a mountain ridge in Taiwan, illustrating that the seismic response may vary significantly among various sites.
This comparative analysis shows where implications for other sites can be inferred. Water from rainfall and snowmelt (and its amount and timing) is indeed the most relevant driving factor at high-magnitude instabilities if strong seismicity is absent. The quantification of the driving effects can be transferred to other similar sites, where the geological context, geomechanical behaviour, and climatic conditions are comparable. Disparities exist mostly among rockslides of different volumes and in different climatic settings. Thus, this comprehensive and quantitative study of the Hochvogel can improve the understanding of general and specific process dynamics and also where future climatic changes may influence these process dynamics.
4.6 Climate change effects
Our results show a clear dependency of slope displacements on infiltrating water from rainfall and snowmelt and of rock fracturing on temperature. Both temperature and the availability of water are subject to climatic changes. While rising minimum, mean, and maximum temperatures are quite evident in Arctic and high-alpine regions especially (e.g. Huss et al., 2017; IPCC, 2019; Picarelli et al., 2021), changes in rainfall and snowmelt patterns remain more uncertain and complex.
In some regions, there is a shift towards more intense and more frequent rainstorms (Zhang et al., 2013; Prein et al., 2017; IPCC, 2013, 2014; Pendergrass et al., 2019). This could lead to generally wetter conditions, a higher water table for longer periods, and higher surface and subsurface flows, which in turn means that less rainfall is needed, as trigger, cohesion, and shear strength are lower; hydrostatic pressure is higher; and erosion increases (Gariano and Guzzetti, 2016). However, projections in the long-term mean conditions might only be of value for promoting effects, as rock slope failures are more likely triggered by short- to medium-duration rainstorms (Krautblatter and Moser, 2009; Picarelli et al., 2021). The northern and western European Alps are projected to become generally wetter, while the southern Alps are becoming dryer, especially in winter and spring (Masson and Frei, 2016). Extreme precipitation events are increasing over large parts of the Alps on an annual scale and during all seasons (Ménégoz et al., 2020), but the effect varies significantly between regions and seasons. The increase is shown to be distinct e.g. in autumn in the southern French Alps (Blanchet et al., 2021), in winter in valleys and medium mountain areas of the northern French Alps (Blanchet et al., 2021), and in autumn (Ménégoz et al., 2020) and winter (Frei et al., 2006) in the southern Alps, but other regions show a significant decrease in extreme precipitation events in some seasons. The direct link between climate change and increased rock slope activity is therefore only given where rainstorm intensity and frequency are exacerbated. For the region of the Hochvogel (Northern Calcareous Alps), an increase in rainstorm activity has been linked to significantly higher debris flow rates (Dietrich and Krautblatter, 2017; Kiefer et al., 2021), leading to the assumption that the Hochvogel is also receiving an increasing number of extreme precipitation events.
Future snowfall and melt dynamics are likely even more undetermined and heterogeneous. Higher temperatures are responsible for a shorter and thinner seasonal snow cover and a shifted melting season (Uhlmann et al., 2009; Huss et al., 2017). Overall, the amount of snowfall is projected to decrease due to more frequent rainfall-favouring conditions; however, cold regions and high-altitude mountain areas might experience slight snowfall increases (Frei et al., 2018; Le Roux et al., 2023). This is due to more frequent extreme snowfall events, a general increase in winter precipitation, and the shift of very cold areas into more snowfall-favouring temperatures. Overall, this implies for the Hochvogel that the timing of the main snowmelt phase will likely be shifted towards earlier in spring and that the total amount of snowmelt could decrease. However, extreme snow events and higher temperatures during the snowmelt phase can also lead to more frequent meltwater peaks (cp. Kawagoe et al., 2009) that can accelerate the unstable mass.
We processed more than 4 years of high-resolution monitoring data from a very active alpine rock slope instability, including displacement, rain, snowmelt, temperature, and seismic observations, to quantify the main drivers and their triggering potential. This methodological procedure can be transferred to similar cases. At the Hochvogel, the acceleration of the unstable mass even due to small environmental impacts proves a highly sensitive close-to-failure status, at least for parts of the summit.
-
During the snowmelt phase in spring, displacements are controlled by meltwater infiltration. The cross-correlation analysis indicates a time lag of 4–9 d between snowmelt input and landslide velocity.
-
During the snow-free summer, rainfall controls displacement rates with a time lag of 1–16 h, indicating the possibility of fast hydrostatic pressure increase in the system. Even small amounts of rainfall can accelerate the mass, and previous water infiltration preconditions the system, in cases of consecutive rain events for few days. The rock cracking frequency is mainly controlled by high temperature with a time lag of 0–15 h, indicating that we mostly detected near-surface crack events.
-
During the first frost of the season in autumn, days with freeze–thaw cycles or clear negative temperatures show higher crack rates. The crack rate might secondarily be controlled by snowmelt or rainfall with low correlation, but it seems not to correlate with displacement directly.
-
During frozen conditions in winter, the landslide activity is generally low.
According to our Newmark analysis, recent and historic earthquakes are too weak to have an immediate triggering potential for a major failure at the Hochvogel, unless the FOS is already very close to 1. Seismic topographic amplification of the peak ground velocity of factor 2–11 in the low frequencies is likely, and the spatial and frequency-wise heterogeneity of amplification at the summit suggest a high damage and criticality of the slope. In summary, we identified water from rain and snowmelt to be the main driving factor. Accelerations of the slope are mostly connected to high water supply rates or additional water supply in pre-saturated conditions. In comparison to other similar sites, the timing and amount of the water supply control the driving effect together with geological context, geomechanical behaviour, and climatic conditions. Future increases in rock mass displacements following small environmental impacts, along with changes in the seismic response to earthquakes, can express a development towards higher criticality. In light of the ongoing climatic changes that can lead to more frequent and intense heavy precipitation events and shifted snowmelt patterns in many places, our findings suggest that the Hochvogel and similar unstable alpine rock slopes may experience a shift in environmental forcing depending on the amount and timing of water supply in the future.
All R codes for data analysis are available in an online repository together with displacement, temperature, and rainfall data from the summit, modelled snowmelt, and derived seismic crack event statistics at https://doi.org/10.5281/zenodo.10567098 (Leinauer, 2024). Snow station data can be obtained from the Bavarian Avalanche Warning Service (Lawinenwarnzentrale im Bayerischen Landesamt für Umwelt). Earthquake catalogues can be accessed at https://services.bgr.de/geophysik/gerseis (BGR, 2023), http://www.seismo.ethz.ch/en/research-and-teaching/products-software/earthquake-catalogues/ (SED, 2023), and https://earthquake.usgs.gov/earthquakes/search/ (USGS, 2023). Seismic raw data sum up to 1.09 TB and are available from the authors upon request.
The supplement related to this article is available online at: https://doi.org/10.5194/esurf-12-1027-2024-supplement.
JL wrote the paper, designed the figures, supervised the real-time monitoring, and performed the synoptical data analysis. MD designed and performed the seismic monitoring. JL and MD analysed the seismic data. JL and SK did the earthquake analysis. RS did the snowmelt modelling. JL and MJ performed the rainfall and snowmelt event analysis. MK and MD supervised the study. All authors improved the final version of the paper.
At least one of the (co-)authors is a member of the editorial board of Earth Surface Dynamics. The peer-review process was guided by an independent editor, and the authors also have no other competing interests to declare.
Publisher's note: Copernicus Publications remains neutral with regard to jurisdictional claims made in the text, published maps, institutional affiliations, or any other geographical representation in this paper. While Copernicus Publications makes every effort to include appropriate place names, the final responsibility lies with the authors.
This study was developed within the AlpSenseRely project. We thank all the numerous colleagues and friends that helped with field work and technical support during the last 5 years and the Bavarian Avalanche Warning Service for providing original snow station data.
This research has been supported by the Bavarian State Ministry of the Environment and Consumer Protection (grant no. TUS01UFS-76976).
This paper was edited by Robert Hilton and reviewed by Maximillian Van Wyk de Vries and one anonymous referee.
Agliardi, F., Scuderi, M. M., Fusi, N., and Collettini, C.: Slow-to-fast transition of giant creeping rockslides modulated by undrained loading in basal shear zones, Nat. Commun., 11, 1352, https://doi.org/10.1038/s41467-020-15093-3, 2020. a
Allen, R.: Automatic phase pickers: Their present use and future prospects, Bull. Seismol. Soc. Am., 72, 225–242, 1882. a
Amitrano, D. and Helmstetter, A.: Brittle creep, damage, and time to failure in rocks, J. Geophys. Res., 111, B11201, https://doi.org/10.1029/2005JB004252, 2006. a
Arias, A.: A Measure of Earthquake Intensity, in: Seismic Design for Nuclear Power Plants, edited by Hansen, R. J., Massachusetts Inst. of Tech. Press, Cambridge, Mass., 438–483, ISBN 9780262080415, 1970. a
Baillard, C., Crawford, W. C., Ballu, V., Hibert, C., and Mangeney, A.: An Automatic Kurtosis-Based P- and S-Phase Picker Designed for Local Seismic Networks, Bull. Seismol. Soc. Am., 104, 394–409, https://doi.org/10.1785/0120120347, 2014. a
Bakun-Mazor, D., Hatzor, Y. H., Glaser, S. D., and Carlos Santamarina, J.: Thermally vs. seismically induced block displacements in Masada rock slopes, Int. J. Rock Mech. Min. Sci., 61, 196–211, https://doi.org/10.1016/j.ijrmms.2013.03.005, 2013. a, b, c, d, e
Ballantyne, C. K., Sandeman, G. F., Stone, J. O., and Wilson, P.: Rock-slope failure following Late Pleistocene deglaciation on tectonically stable mountainous terrain, Quaternary Sci. Rev., 86, 144–157, https://doi.org/10.1016/j.quascirev.2013.12.021, 2014. a
Barbosa, N., Leinauer, J., Jubanski, J., Dietze, M., Münzer, U., Siegert, F., and Krautblatter, M.: Massive sediment pulses triggered by a multi-stage 130 000 m3 alpine cliff fall (Hochvogel, DE–AT), Earth Surf. Dynam., 12, 249–269, https://doi.org/10.5194/esurf-12-249-2024, 2024. a
BGR: Deutscher Erdbebenkatalog: Bundesanstalt für Geowissenschaften und Rohstoffe, BGR [data set], https://services.bgr.de/geophysik/gerseis (last access: 1 December 2023), 2023. a
Blanchet, J., Blanc, A., and Creutin, J.-D.: Explaining recent trends in extreme precipitation in the Southwestern Alps by changes in atmospheric influences, Weather Clim. Extrem., 33, 100356, https://doi.org/10.1016/j.wace.2021.100356, 2021. a, b
Blikra, L. H. and Christiansen, H. H.: A field-based model of permafrost-controlled rockslide deformation in northern Norway, Geomorphology, 208, 34–49, https://doi.org/10.1016/j.geomorph.2013.11.014, 2014. a, b
Borri-Brunetto, M., Carpinteri, A., and Chiaia, B.: The Effect of Scale and Criticality in Rock Slope Stability, Rock Mech. Rock Eng., 37, 117–126, https://doi.org/10.1007/s00603-003-0004-1, 2004. a
Breiman, L.: Random Forests, Mach. Learn., 45, 5–32, https://doi.org/10.1023/A:1010933404324, 2001. a
Burjánek, J., Gassner-Stamm, G., Poggi, V., Moore, J. R., and Fäh, D.: Ambient vibration analysis of an unstable mountain slope, Geophys. J. Int., 180, 820–828, https://doi.org/10.1111/j.1365-246X.2009.04451.x, 2010. a, b, c
Burjánek, J., Moore, J. R., Yugsi Molina, F. X., and Fäh, D.: Instrumental evidence of normal mode rock slope vibration, Geophys. J. Int., 188, 559–569, https://doi.org/10.1111/j.1365-246X.2011.05272.x, 2012. a, b, c, d
Chae, B.-G., Park, H.-J., Catani, F., Simoni, A., and Berti, M.: Landslide prediction, monitoring and early warning: a concise review of state-of-the-art, Geosci. J., 21, 1033–1070, https://doi.org/10.1007/s12303-017-0034-4, 2017. a
Crosta, G. B. and Agliardi, F.: Failure forecast for large rock slides by surface displacement measurements, Can. Geotech. J., 40, 176–191, https://doi.org/10.1139/T02-085, 2003. a
Crosta, G. B., Di Prisco, C., Frattini, P., Frigerio, G., Castellanza, R., and Agliardi, F.: Chasing a complete understanding of the triggering mechanisms of a large rapidly evolving rockslide, Landslides, 11, 747–764, https://doi.org/10.1007/s10346-013-0433-1, 2014. a
Dietrich, A. and Krautblatter, M.: Evidence for enhanced debris-flow activity in the Northern Calcareous Alps since the 1980s (Plansee, Austria), Geomorphology, 287, 144–158, https://doi.org/10.1016/j.geomorph.2016.01.013, 2017. a
Dietze, M.: The R package “eseis” – a software toolbox for environmental seismology, Earth Surf. Dynam., 6, 669–686, https://doi.org/10.5194/esurf-6-669-2018, 2018a. a
Dietze, M.: `eseis' – a comprehensive R software toolbox for environmental seismology, GFZ Data Services [code], https://doi.org/10.5880/GFZ.5.1.2018.001, 2018b. a
Dietze, M., Burtin, A., Simard, S., and Hovius, N.: The mediating role of trees – transfer and feedback mechanisms of wind-driven seismic activity, in: EGU General Assembly Conference, Geophys. Res. Abstr., 17, EGU2015-5118, 2015. a
Dietze, M., Mohadjer, S., Turowski, J. M., Ehlers, T. A., and Hovius, N.: Seismic monitoring of small alpine rockfalls – validity, precision and limitations, Earth Surf. Dynam., 5, 653–668, https://doi.org/10.5194/esurf-5-653-2017, 2017a. a
Dietze, M., Turowski, J. M., Cook, K. L., and Hovius, N.: Spatiotemporal patterns, triggers and anatomies of seismically detected rockfalls, Earth Surf. Dynam., 5, 757–779, https://doi.org/10.5194/esurf-5-757-2017, 2017b. a, b, c
Dietze, M., Krautblatter, M., Illien, L., and Hovius, N.: Seismic constraints on rock damaging related to a failing mountain peak: the Hochvogel, Allgäu, Earth Surf. Proc. Land., 46, 417–429, https://doi.org/10.1002/esp.5034, 2021. a, b, c, d, e, f, g, h
Eberhardt, E., Stead, D., and Coggan, J. S.: Numerical analysis of initiation and progressive failure in natural rock slopes – the 1991 Randa rockslide, Int. J. Rock Mech. Min. Sci., 41, 69–87, https://doi.org/10.1016/S1365-1609(03)00076-5, 2004. a
Erismann, T. H. and Abele, G.: Dynamics of rockslides and rockfalls, Springer, Berlin, Heidelberg, ISBN 978-3-662-04639-5, https://doi.org/10.1007/978-3-662-04639-5, 2001. a, b
Evans, S. G., Mugnozza, G. S., Strom, A., Hermanns, R. L., Ischuk, A., and Vinnichenko, S.: Landslides from massive rock slope failure and associated phenomena, in: Landslides from Massive Rock Slope Failure, vol. 49 of NATO Science Series, edited by: Evans, S. G., Mugnozza, G. S., Strom, A., and Hermanns, R. L., Springer Netherlands, Dordrecht, 3–52, ISBN 978-1-4020-4035-1, https://doi.org/10.1007/978-1-4020-4037-5_1, 2006. a, b
Frei, C., Schöll, R., Fukutome, S., Schmidli, J., and Vidale, P. L.: Future change of precipitation extremes in Europe: Intercomparison of scenarios from regional climate models, J. Geophys. Res., 111, D06105, https://doi.org/10.1029/2005JD005965, 2006. a
Frei, P., Kotlarski, S., Liniger, M. A., and Schär, C.: Future snowfall in the Alps: projections based on the EURO-CORDEX regional climate models, The Cryosphere, 12, 1–24, https://doi.org/10.5194/tc-12-1-2018, 2018. a
Gariano, S. L. and Guzzetti, F.: Landslides in a changing climate, Earth-Sci. Rev., 162, 227–252, https://doi.org/10.1016/j.earscirev.2016.08.011, 2016. a, b
Gischig, V., Preisig, G., and Eberhardt, E.: Numerical Investigation of Seismically Induced Rock Mass Fatigue as a Mechanism Contributing to the Progressive Failure of Deep-Seated Landslides, Rock Mech. Rock Eng., 49, 2457–2478, https://doi.org/10.1007/s00603-015-0821-z, 2016. a, b, c, d, e, f, g, h, i
Guzzetti, F.: On the Prediction of Landslides and Their Consequences, in: Understanding and Reducing Landslide Disaster Risk, ICL Contribution to Landslide Disaster Risk Reduction, edited by: Sassa, K., Mikoš, M., Sassa, S., Bobrowsky, P. T., Takara, K., and Dang, K., Springer International Publishing, Cham, 3–32, ISBN 978-3-030-60195-9, https://doi.org/10.1007/978-3-030-60196-6_1, 2021. a
Harp, E. L. and Jibson, R. W.: Anomalous Concentrations of Seismically Triggered Rock Falls in Pacoima Canyon: Are They Caused by Highly Susceptible Slopes or Local Amplification of Seismic Shaking?, Bull. Seismol. Soc. Am., 92, 3180–3189, https://doi.org/10.1785/0120010171, 2002. a
Heckmann, T., Bimböse, M., Krautblatter, M., Haas, F., Becht, M., and Morche, D.: From geotechnical analysis to quantification and modelling using LiDAR data: a study on rockfall in the Reintal catchment, Bavarian Alps, Germany, Earth Surf. Proc. Land., 37, 119–133, https://doi.org/10.1002/esp.2250, 2012. a
Helmstetter, A. and Garambois, S.: Seismic monitoring of Séchilienne rockslide (French Alps): Analysis of seismic signals and their correlation with rainfalls, J. Geophys. Res., 115, F03016, https://doi.org/10.1029/2009JF001532, 2010. a, b, c, d
Hibert, C., Mangeney, A., Grandjean, G., and Shapiro, N. M.: Slope instabilities in Dolomieu crater, Réunion Island: From seismic signals to rockfall characteristics, J. Geophys. Res., 116, F04032, https://doi.org/10.1029/2011JF002038, 2011. a
Hibert, C., Provost, F., Malet, J.-P., Maggi, A., Stumpf, A., and Ferrazzini, V.: Automatic identification of rockfalls and volcano-tectonic earthquakes at the Piton de la Fournaise volcano using a Random Forest algorithm, J. Volcanol. Geoth. Res., 340, 130–142, https://doi.org/10.1016/j.jvolgeores.2017.04.015, 2017. a, b, c, d
Hilger, P., Hermanns, R. L., Czekirda, J., Myhra, K. S., Gosse, J. C., and Etzelmüller, B.: Permafrost as a first order control on long-term rock-slope deformation in (Sub-)Arctic Norway, Quaternary Sci. Rev., 251, 106718, https://doi.org/10.1016/j.quascirev.2020.106718, 2021. a
Huss, M., Bookhagen, B., Huggel, C., Jacobsen, D., Bradley, R. S., Clague, J. J., Vuille, M., Buytaert, W., Cayan, D. R., Greenwood, G., Mark, B. G., Milner, A. M., Weingartner, R., and Winder, M.: Toward mountains without permanent snow and ice, Earth's Future, 5, 418–435, https://doi.org/10.1002/2016EF000514, 2017. a, b, c
Hutter, P.: Damals im Oberallgäu: Geschichte(n) aus der südlichsten Region Deutschlands, in: 1st. Edn., Ed. Limosa, Clenze, ISBN 978-3-86037-401-6, 2010. a
IPCC (Ed.): Climate change 2013: The physical science basis, in: Working Group I contribution to the fifth assessment report of the Intergovernmental Panel on Climate Change, Cambridge University Press, Cambridge, UK and New York, NY, USA, ISBN 978-1-107-66182-0, https://doi.org/10.1017/CBO9781107415324, 2013. a
IPCC (Ed.): Climate Change 2014: Impacts, Adaptation, and Vulnerability. Part B: Regional Aspects, in: Contribution of Working Group II to the Fifth Assessment Report of the Intergovernmental Panel on Climate Change, Cambridge University Press, Cambridge, UK and New York, NY, USA, ISBN 978-1-107-68386-0, 2014. a
IPCC (Ed.): Climate Change and Land: an IPCC special report on climate change, desertification, land degradation, sustainable land management, food security, and greenhouse gas fluxes in terrestrial ecosystem, edited by: Shukla, P. R., Skea, J., Calvo Buendia, E., Masson-Delmotte, V., Pörtner, H.-O., Roberts, D. C., Zhai, P., Slade, R., Connors, S., van Diemen, R., Ferrat, M., Haughey, E., Luz, S., Neogi, S., Pathak, M., Petzold, J., Portugal Pereira, J., Vyas, P., Huntley, E., Kissick, K., Belkacemi, M., and Malley, J., Cambridge University Press, in press, 2019. a, b
Jibson, R. W.: Predicting earthquake-induced landslide displacements using Newmark's sliding block analysis, Transportation Research Record, Transportation Research Record 1411, 9–17, http://onlinepubs.trb.org/Onlinepubs/trr/1993/1411/1411-002.pdf (last access: 1 December 2023), 1993. a, b
Jibson, R. W.: Regression models for estimating coseismic landslide displacement, Eng. Geol., 91, 209–218, https://doi.org/10.1016/j.enggeo.2007.01.013, 2007. a
Jibson, R. W., Harp, E. L., and Michael, J. A.: A method for producing digital probabilistic seismic landslide hazard maps, Eng. Geol., 58, 271–289, https://doi.org/10.1016/S0013-7952(00)00039-9, 2000. a, b
Jibson, R. W., Harp, E. L., Schulz, W., and Keefer, D. K.: Large rock avalanches triggered by the M 7.9 Denali Fault, Alaska, earthquake of 3 November 2002, Eng. Geol., 83, 144–160, https://doi.org/10.1016/j.enggeo.2005.06.029, 2006. a
Kawagoe, S., Kazama, S., and Ranjan Sarukkalige, P.: Assessment of snowmelt triggered landslide hazard and risk in Japan, Cold Reg. Sci. Technol., 58, 120–129, https://doi.org/10.1016/j.coldregions.2009.05.004, 2009. a, b, c
Kemeny, J.: The Time-Dependent Reduction of Sliding Cohesion due to Rock Bridges Along Discontinuities: A Fracture Mechanics Approach, Rock Mech. Rock Eng., 36, 27–38, https://doi.org/10.1007/s00603-002-0032-2, 2003. a
Khan, S., van der Meijde, M., van der Werff, H., and Shafique, M.: The impact of topography on seismic amplification during the 2005 Kashmir earthquake, Nat. Hazards Earth Syst. Sci., 20, 399–411, https://doi.org/10.5194/nhess-20-399-2020, 2020. a, b
Kiefer, C., Oswald, P., Moernaut, J., Fabbri, S. C., Mayr, C., Strasser, M., and Krautblatter, M.: A 4000-year debris flow record based on amphibious investigations of fan delta activity in Plansee (Austria, Eastern Alps), Earth Surf. Dynam., 9, 1481–1503, https://doi.org/10.5194/esurf-9-1481-2021, 2021. a
Knapp, S., Gilli, A., Anselmetti, F. S., Krautblatter, M., and Hajdas, I.: Multistage Rock–Slope Failures Revealed in Lake Sediments in a Seismically Active Alpine Region (Lake Oeschinen, Switzerland), J. Geophys. Res.-Earth, 123, 658–677, https://doi.org/10.1029/2017JF004455, 2018. a, b
Krautblatter, M. and Moser, M.: A nonlinear model coupling rockfall and rainfall intensity based on a four year measurement in a high Alpine rock wall (Reintal, German Alps), Nat. Hazards Earth Syst. Sci., 9, 1425–1432, https://doi.org/10.5194/nhess-9-1425-2009, 2009. a
Krautblatter, M., Funk, D., and Günzel, F. K.: Why permafrost rocks become unstable: a rock–ice–mechanical model in time and space, Earth Surf. Proc. Land., 38, 876–887, https://doi.org/10.1002/esp.3374, 2013. a
Kristensen, L., Czekirda, J., Penna, I., Etzelmüller, B., Nicolet, P., Pullarello, J. S., Blikra, L. H., Skrede, I., Oldani, S., and Abellan, A.: Movements, failure and climatic control of the Veslemannen rockslide, Western Norway, Landslides, 18, 1963–1980, https://doi.org/10.1007/s10346-020-01609-x, 2021. a, b, c
Krøgli, I. K., Devoli, G., Colleuille, H., Boje, S., Sund, M., and Engen, I. K.: The Norwegian forecasting and warning service for rainfall- and snowmelt-induced landslides, Nat. Hazards Earth Syst. Sci., 18, 1427–1450, https://doi.org/10.5194/nhess-18-1427-2018, 2018. a, b
Lacasse, S. and Nadim, F.: Landslide Risk Assessment and Mitigation Strategy, in: Landslides – Disaster Risk Reduction, edited by: Sassa, K. and Canuti, P., Springer, Berlin, Heidelberg, 31–61, ISBN 978-3-540-69966-8, https://doi.org/10.1007/978-3-540-69970-5_3, 2009. a
Lagarde, S., Dietze, M., Hammer, C., Zeckra, M., Voigtländer, A., Illien, L., Schöpa, A., Hirschberg, J., Burtin, A., Hovius, N., and Turowski, J. M.: Rock slope failure preparation paced by total crack boundary length, Commun. Earth Environ., 4, 201, https://doi.org/10.1038/s43247-023-00851-0, 2023. a, b, c, d, e
LaHusen, S. R., Duvall, A. R., Booth, A. M., Grant, A., Mishkin, B. A., Montgomery, D. R., Struble, W., Roering, J. J., and Wartman, J.: Rainfall triggers more deep-seated landslides than Cascadia earthquakes in the Oregon Coast Range, USA, Sci. Adv., 6, eaba6790, https://doi.org/10.1126/sciadv.aba6790, 2020. a, b
Langet, N. and Silverberg, F. M. J.: Automated classification of seismic signals recorded on the Åknes rock slope, Western Norway, using a convolutional neural network, Earth Surf. Dynam., 11, 89–115, https://doi.org/10.5194/esurf-11-89-2023, 2023. a, b
Lee, S.-J., Chan, Y.-C., Komatitsch, D., Huang, B.-S., and Tromp, J.: Effects of Realistic Surface Topography on Seismic Ground Motion in the Yangminshan Region of Taiwan Based Upon the Spectral-Element Method and LiDAR DTM, Bull. Seismol. Soc. Am., 99, 681–693, https://doi.org/10.1785/0120080264, 2009a. a, b
Lee, S.-J., Komatitsch, D., Huang, B.-S., and Tromp, J.: Effects of Topography on Seismic-Wave Propagation: An Example from Northern Taiwan, Bull. Seismol. Soc. Am., 99, 314–325, https://doi.org/10.1785/0120080020, 2009b. a
Lehning, M., Bartelt, P., Brown, B., Russi, T., Stöckli, U., and Zimmerli, M.: Snowpack model calculations for avalanche warning based upon a new network of weather and snow stations, Cold Reg. Sci. Technol., 30, 145–157, https://doi.org/10.1016/S0165-232X(99)00022-1, 1999. a
Leinauer, J.: Collection of R-codes and data for analysis of drivers at the Hochvogel rock slope instability, Zenodo [code and data set], https://doi.org/10.5281/zenodo.10567098, 2024. a, b, c
Leinauer, J., Jacobs, B., and Krautblatter, M.: Anticipating an imminent large rock slope failure at the Hochvogel (Allgäu Alps), Geomech. Tunnel., 13, 597–603, https://doi.org/10.1002/geot.202000027, 2020. a, b, c
Leinauer, J., Jacobs, B., and Krautblatter, M.: High alpine geotechnical real time monitoring and early warning at a large imminent rock slope failure (Hochvogel, GER/AUT), IOP Conf. Ser.: Earth Environ. Sci., 833, 012146, https://doi.org/10.1088/1755-1315/833/1/012146, 2021. a
Leinauer, J., Weber, S., Cicoira, A., Beutel, J., and Krautblatter, M.: An approach for prospective forecasting of rock slope failure time, Commun. Earth Environ., 4, 253, https://doi.org/10.1038/s43247-023-00909-z, 2023. a
Le Roux, E., Evin, G., Samacoïts, R., Eckert, N., Blanchet, J., and Morin, S.: Projection of snowfall extremes in the French Alps as a function of elevation and global warming level, The Cryosphere, 17, 4691–4704, https://doi.org/10.5194/tc-17-4691-2023, 2023. a
Loew, S., Gschwind, S., Gischig, V., Keller-Signer, A., and Valenti, G.: Monitoring and early warning of the 2012 Preonzo catastrophic rockslope failure, Landslides, 14, 141–154, https://doi.org/10.1007/s10346-016-0701-y, 2017. a
Lorenzi, V., Banzato, F., Barberio, M. D., Goeppert, N., Goldscheider, N., Gori, F., Lacchini, A., Manetta, M., Medici, G., Rusi, S., and Petitta, M.: Tracking flowpaths in a complex karst system through tracer test and hydrogeochemical monitoring: Implications for groundwater protection (Gran Sasso, Italy), Heliyon, 10, e24663, https://doi.org/10.1016/j.heliyon.2024.e24663, 2024. a
Lott, F. F., Ritter, J. R. R., Al-Qaryouti, M., and Corsmeier, U.: On the Analysis of Wind-Induced Noise in Seismological Recordings, Pure Appl. Geophys., 174, 1453–1470, https://doi.org/10.1007/s00024-017-1477-2, 2017. a
Mamot, P., Weber, S., Eppinger, S., and Krautblatter, M.: A temperature-dependent mechanical model to assess the stability of degrading permafrost rock slopes, Earth Surf. Dynam., 9, 1125–1151, https://doi.org/10.5194/esurf-9-1125-2021, 2021. a
Marc, O., Hovius, N., Meunier, P., Gorum, T., and Uchida, T.: A seismologically consistent expression for the total area and volume of earthquake-triggered landsliding, J. Geophys. Res.-Earth, 121, 640–663, https://doi.org/10.1002/2015JF003732, 2016. a
Massey, C. I., Olsen, M. J., Wartman, J., Senogles, A., Lukovic, B., Leshchinsky, B. A., Archibald, G., Litchfield, N., van Dissen, R., de Vilder, S., and Holden, C.: Rockfall Activity Rates Before, During and After the 2010/2011 Canterbury Earthquake Sequence, J. Geophys. Res.-Earth, 127, e2021JF006400, https://doi.org/10.1029/2021JF006400, 2022. a, b, c, d
Masson, D. and Frei, C.: Long-term variations and trends of mesoscale precipitation in the Alps: recalculation and update for 1901–2008, Int. J. Climat., 36, 492–500, https://doi.org/10.1002/joc.4343, 2016. a
Ménégoz, M., Valla, E., Jourdain, N. C., Blanchet, J., Beaumet, J., Wilhelm, B., Gallée, H., Fettweis, X., Morin, S., and Anquetin, S.: Contrasting seasonal changes in total and intense precipitation in the European Alps from 1903 to 2010, Hydrol. Earth Syst. Sci., 24, 5355–5377, https://doi.org/10.5194/hess-24-5355-2020, 2020. a, b
Meunier, P., Hovius, N., and Haines, A. J.: Regional patterns of earthquake-triggered landslides and their relation to ground motion, Geophys. Res. Lett., 34, L20408, https://doi.org/10.1029/2007GL031337, 2007. a, b, c, d
Meunier, P., Hovius, N., and Haines, J. A.: Topographic site effects and the location of earthquake induced landslides, Earth Planet. Sc. Lett., 275, 221–232, https://doi.org/10.1016/j.epsl.2008.07.020, 2008. a, b
Meyenfeld, H.: Modellierungen seismisch ausgelöster gravitativer Massenbewegungen für die Schwäbische Alb und den Raum Bonn und Erstellen von Gefahrenhinweiskarten: Dissertation, ULB Bonn, Bonn, https://bonndoc.ulb.uni-bonn.de/xmlui/handle/20.500.11811/4047 (last access: 1 December 2023), 2009. a, b
Miles, S. B. and Keefer, D. K.: Seismic Landslide Hazard for the City of Berkeley, California, US Geological Survey, https://doi.org/10.3133/mf2378, 2001. a, b
Mulas, M., Marnas, M., Ciccarese, G., and Corsini, A.: Sinusoidal wave fit indexing of irreversible displacements for crackmeters monitoring of rockfall areas: test at Pietra di Bismantova (Northern Apennines, Italy), Landslides, 17, 231–240, https://doi.org/10.1007/s10346-019-01248-x, 2020. a, b
Newmark, N. M.: Effects of earthquakes on dams and embankments, Geotechnique, 15, 139–160, 1965. a, b
Oswald, P., Strasser, M., Hammerl, C., and Moernaut, J.: Seismic control of large prehistoric rockslides in the Eastern Alps, Nat. Commun., 12, 1059, https://doi.org/10.1038/s41467-021-21327-9, 2021. a, b, c, d
Oswald, P., Strasser, M., Skapski, J., and Moernaut, J.: Magnitude and source area estimations of severe prehistoric earthquakes in the western Austrian Alps, Nat. Hazards Earth Syst. Sci., 22, 2057–2079, https://doi.org/10.5194/nhess-22-2057-2022, 2022. a, b
Pecoraro, G., Calvello, M., and Piciullo, L.: Monitoring strategies for local landslide early warning systems, Landslides, 16, 213–231, https://doi.org/10.1007/s10346-018-1068-z, 2019. a
Pendergrass, A. G., Coleman, D. B., Deser, C., Lehner, F., Rosenbloom, N., and Simpson, I. R.: Nonlinear Response of Extreme Precipitation to Warming in CESM1, Geophys. Res. Lett., 46, 10551–10560, https://doi.org/10.1029/2019GL084826, 2019. a, b
Petley, D. N.: The evolution of slope failures: mechanisms of rupture propagation, Nat. Hazards Earth Syst. Sci., 4, 147–152, https://doi.org/10.5194/nhess-4-147-2004, 2004. a
Picarelli, L., Lacasse, S., and Ho, K. K. S.: The Impact of Climate Change on Landslide Hazard and Risk, in: Understanding and Reducing Landslide Disaster Risk, ICL Contribution to Landslide Disaster Risk Reduction, edited by: Sassa, K., Mikoš, M., Sassa, S., Bobrowsky, P. T., Takara, K., and Dang, K., Springer International Publishing, Cham, 131–141, ISBN 978-3-030-60195-9, https://doi.org/10.1007/978-3-030-60196-6_6, 2021. a, b, c
Prein, A. F., Liu, C., Ikeda, K., Trier, S. B., Rasmussen, R. M., Holland, G. J., and Clark, M. P.: Increased rainfall volume from future convective storms in the US, Nat. Clim. Change, 7, 880–884, https://doi.org/10.1038/s41558-017-0007-7, 2017. a
Preisig, G., Eberhardt, E., Smithyman, M., Preh, A., and Bonzanigo, L.: Hydromechanical Rock Mass Fatigue in Deep-Seated Landslides Accompanying Seasonal Variations in Pore Pressures, Rock Mech. Rock Eng., 49, 2333–2351, https://doi.org/10.1007/s00603-016-0912-5, 2016. a
Provost, F., Hibert, C., and Malet, J.-P.: Automatic classification of endogenous landslide seismicity using the Random Forest supervised classifier, Geophys. Res. Lett., 44, 113–120, https://doi.org/10.1002/2016GL070709, 2017. a, b, c
Rault, C., Chao, W.-A., Gelis, C., Burtin, A., Chang, J.-M., Marc, O., Lai, T.-S., Wu, Y.-M., Hovius, N., and Meunier, P.: Seismic Response of a Mountain Ridge Prone to Landsliding, Bull. Seismol. Soc. Am., 110, 3004–3020, https://doi.org/10.1785/0120190127, 2020. a, b, c, d, e
R Core Team: R: A Language and Environment for Statistical Computing, https://www.R-project.org/ (last access: 1 December 2023), 2023. a
Sättele, M., Krautblatter, M., Bründl, M., and Straub, D.: Forecasting rock slope failure: how reliable and effective are warning systems?, Landslides, 13, 737–750, https://doi.org/10.1007/s10346-015-0605-2, 2016. a
Scandroglio, R., Stoll, V., and Krautblatter, M.: The driving force of all nature. Modelling water pressure and its stability consequences on alpine bedrock slopes, IOP Conf. Ser.: Earth Environ. Sci., 833, 012109, https://doi.org/10.1088/1755-1315/833/1/012109, 2021. a, b
SED: Earthquake Catalogue: Swiss Seismological Service, SED [data set], http://www.seismo.ethz.ch/en/research-and-teaching/products-software/earthquake-catalogues/ (last access: 1 December 2023), 2023. a
Senfaute, G., Duperret, A., and Lawrence, J. A.: Micro-seismic precursory cracks prior to rock-fall on coastal chalk cliffs: a case study at Mesnil-Val, Normandie, NW France, Nat. Hazards Earth Syst. Sci., 9, 1625–1641, https://doi.org/10.5194/nhess-9-1625-2009, 2009. a, b
Sepúlveda, S. A., Murphy, W., Jibson, R. W., and Petley, D. N.: Seismically induced rock slope failures resulting from topographic amplification of strong ground motions: The case of Pacoima Canyon, California, Eng. Geol., 80, 336–348, https://doi.org/10.1016/j.enggeo.2005.07.004, 2005. a
Stock, G., Collins, B., Santaniello, D., Zimmer, V., Wieczorek, G., and Synder, J.: Historical rock falls in Yosemite National Park, California (1857–2011), Data Series 746, U.S. Geological Survey Data Series, http://pubs.usgs.gov/ds/746/ (last access: 1 December 2023), 2013. a, b, c, d, e, f
Uhlmann, B., Goyette, S., and Beniston, M.: Sensitivity analysis of snow patterns in Swiss ski resorts to shifts in temperature, precipitation and humidity under conditions of climate change, Int. J. Climatol., 29, 1048–1055, https://doi.org/10.1002/joc.1786, 2009. a
USGS: Earthquake Catalogue, US Geological Survey, USGS [data set], https://earthquake.usgs.gov/earthquakes/search/ (last access: 1 December 2023), 2023. a
Voigtländer, A., Leith, K., and Krautblatter, M.: Subcritical Crack Growth and Progressive Failure in Carrara Marble Under Wet and Dry Conditions, J. Geophys. Res.-Solid, 123, 3780–3798, https://doi.org/10.1029/2017JB014956, 2018. a
Weber, S., Beutel, J., Faillettaz, J., Hasler, A., Krautblatter, M., and Vieli, A.: Quantifying irreversible movement in steep, fractured bedrock permafrost on Matterhorn (CH), The Cryosphere, 11, 567–583, https://doi.org/10.5194/tc-11-567-2017, 2017. a, b, c, d, e, f
Weber, S., Beutel, J., Häusler, M., Geimer, P. R., Fäh, D., and Moore, J. R.: Spectral amplification of ground motion linked to resonance of large-scale mountain landforms, Earth Planet. Sc. Lett., 578, 117295, https://doi.org/10.1016/j.epsl.2021.117295, 2022. a, b, c, d, e, f
Wenner, M., Hibert, C., van Herwijnen, A., Meier, L., and Walter, F.: Near-real-time automated classification of seismic signals of slope failures with continuous random forests, Nat. Hazards Earth Syst. Sci., 21, 339–361, https://doi.org/10.5194/nhess-21-339-2021, 2021. a, b
Wieczorek, G.: Landslide triggering mechanisms, in: Landslides – investigation and mitigation, edited by: Turner, A. and Schuster, R., National Academy Press, 76–90, ISBN 0-309-06151-2, 1996. a, b, c
Wilson, R. C. and Keefer, D. K.: Predicting Areal Limits of Earthquake-Induced Landsliding, in: Evaluating Earthquake Hazards in the Los Angeles Region – An Earth-Science Perspective, USGS – US Geological Survey, 316–345, https://doi.org/10.3133/pp1360, 1985. a, b, c
Wyllie, D. C. and Mah, C. W.: Rock slope engineering: Civil and mining, in: 4th Edn.,Spon Press, New York, NY, ISBN 978-0-415-28001-3, http://www.loc.gov/catdir/enhancements/fy0650/2003014937-d.html (last access: 1 December 2023), 2004. a
Zhang, X., Wan, H., Zwiers, F. W., Hegerl, G. C., and Min, S.-K.: Attributing intensification of precipitation extremes to human influence, Geophys. Res. Lett., 40, 5252–5257, https://doi.org/10.1002/grl.51010, 2013. a